Quick Intelligence Designer
The designer is where you can modify existing visualizations or imagine new ones.
We’ve made our data exploration smart to reduce time to results. We find meaningful results for you and we make assumptions to visualize them instantly. But you can go further. Anyone is able to modify our assumptions and get to their desired visualization. You are the creator, you are the designer. We’re just here to make your life easier.
We also understand that many end users might not really care to design their stuff. They just need to get to answers quickly and efficiently with your guidance. So we've developed easily accessible tools in our designer to help you guide users on their journey to immediately valuable insights. By the way, this same designer is available to your clients, because they may have super users of their own.
The four main parts of the Quick Intelligence Designer are the:
- Search Bar - find exactly the information you are looking
- Visualization Properties - configure the visualization to meet your presentation needs
- Suggestions - get help and insights on AI recommended questions
- Data Explorer - view all the available data elements with descriptions from your data sets
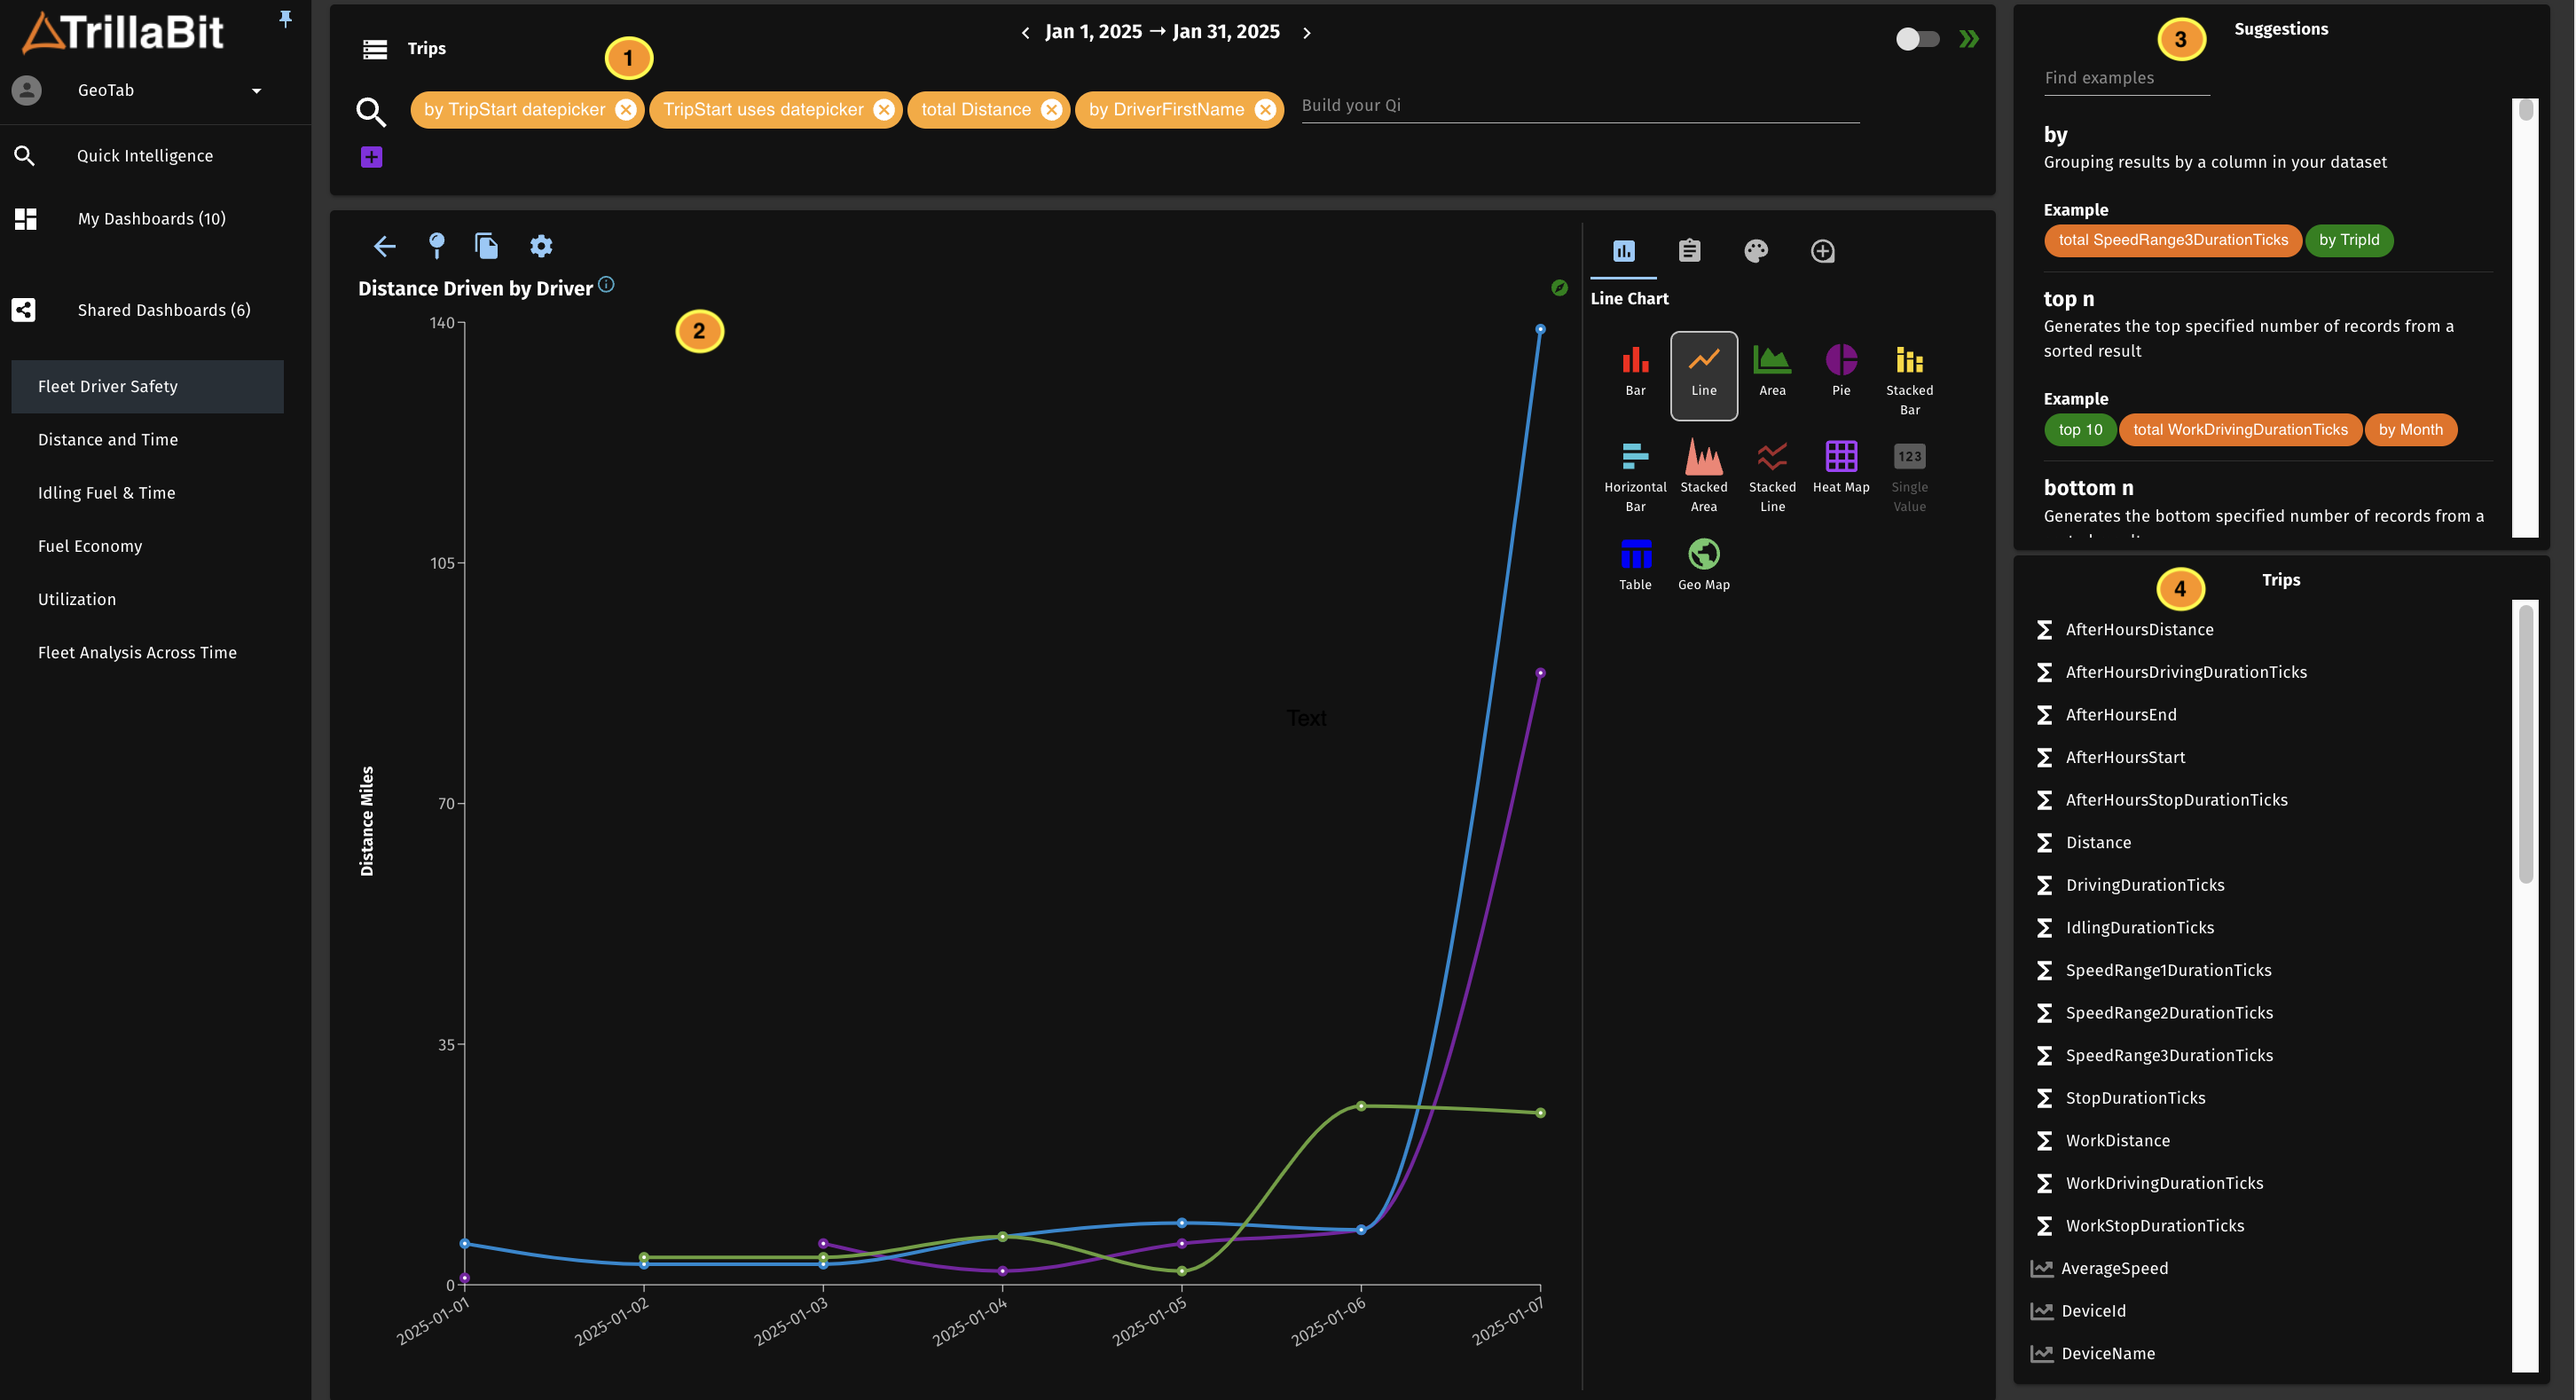
1. Search Bar
The search bar provides an easy way to get answers to important questions.
- Type Ahead Attribute reference
- Type ahead keyword reference
- Virtual attributes - calculated fields
- Keywords for complex operators
- Integrated datepicker

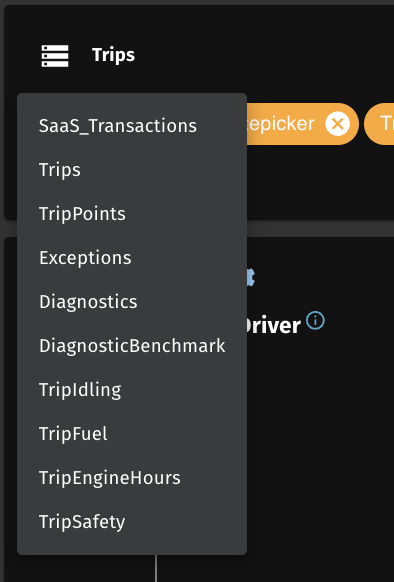
Dataset Selection
The Quick Intelligence Designer is based on asking questions within a dataset. A Dataset is preconfigured in the admin section for end users to use. Often a dataset reflects some business concept like Sales or Orders or Trips etc...
To Select a dataset simply click the dataset icon in the top left side of the search bar and select a dataset.
This tells the engine what we're about to work with.
Type Ahead
A question should be comprised of some basic elements. these elements are often totals, filters and sometimes aggregations. For instnce: Total sales last year by Department.
In the search bar these elements are reflected as tokens. Each token is comprised of a key word and an attribute, and sometimes a value for filter operators.
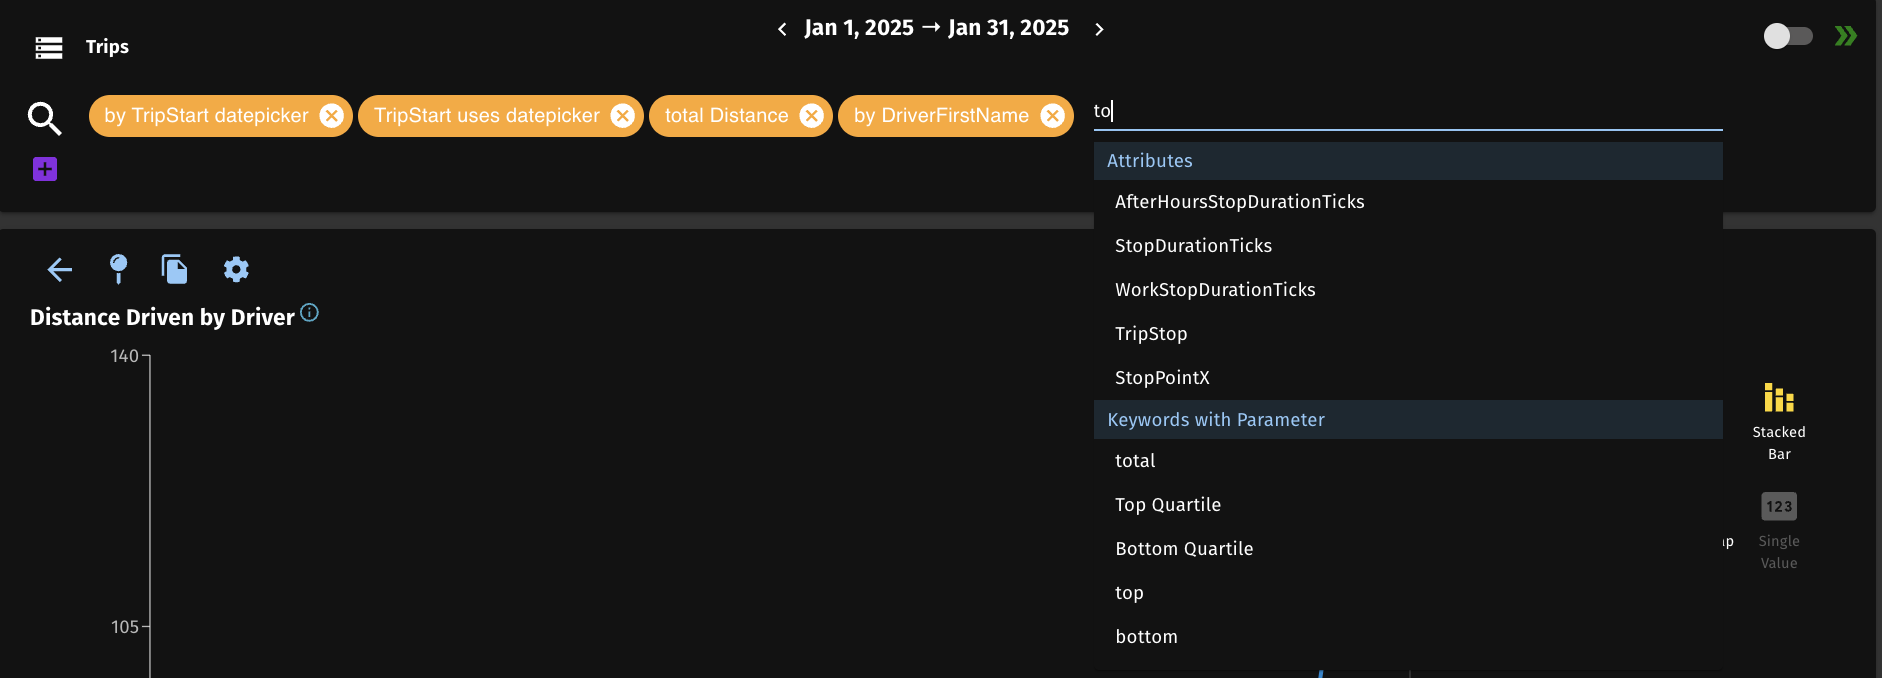
As you type, the search bar determines what the types of things you might want next in a dropdown under your text.
You can type in partial text to find what you're looking for. With this functionality you don't always need to remember the exact name or value or value format. the search bar gives it to you.
If you simply start typing 'dat' the search bar will bring options of Attributes, keywords and oparators that might have the string 'dat' in them.
From here you can either finish typing your token or select from the list.
When the token is complete, and you can hit [Enter] and you will see the token turn orange, meaning it's ready to run your query by selecting the search icon beside the bar.
To learn more please goto learning videos and we'll walk you through this.
Datepicker Configuration
The datepicker usage is covered in the Dashboard section of this UserGuide, However it is in this Quick Intelligence screen Searchbar where it is configured.
There are essentially 3 areas of configuration for the date picker.
- Date Range
- Aggregation Grain
- The Comparison Date Range
In the Serach bar, you are simply telling the visualization how to use the date picker.
Date Range
The Date Range is essentially a filter. To configure this you need to tell the search how to filter. You simply type in or select a Date type attribute. When selected hit space you will see the [Assign DatePicker] in the options form the type-ahead. The understand this might be a desired option. Then select [uses datepicker]. Now the engine knows to use the datepicker as the source of values on the attribute you've chosen.
Aggregation Grain
If you want to create a trend graph, then you need to group by some grain of time. i.e. Days, Weeks, Months, Year. You can make this a dynamic select for the user by tying this to the datepicker.
Group bys in the searchbar are defined with the [By] keyword. i.e. [By MonthName] as a token. but you can configure this to use date picker in a similar way as the filter.
Simply type [By] select select a date type attribute. When you enter space, the option will appear to select [datepicker]. by selecting this the full token will be [by date datepicker] and the engine will now know to switch out the group by based on what is selected in teh date picker.
Comparison Date Range
Much like the Date Range, all actions are the same, except choose [use comparisondatepicker] This will now use the comparison range in the date picker.
Today we cannot use both the main daterange and the comparison date range in the same query. None of the current graphs support this. it's only one or the other.
However! Analytic cards are a new feature coming soon where you will be able to combine these and the system will know just how to handle it for you.
Advanced Query
The Advanced Query option is for wrapping one question in another. Because we're still interacting with SQL engines, sometimes you can get everything you want in a single statement.
For instance if you want to see a daily average over a year, First to need to query for the average by Day. Then in the advanced query you can then group that to a year, which will provide you with your weighted averge.
the Advanced query will only look look for elements created in the first search query, then allow you to perform other operations on top of that. Essentially treating your first query like a sub query. (for those of you who are SQL savvy - aka Advanced)
In the future, we plan to eliminate this with simple keywords that do complex things.
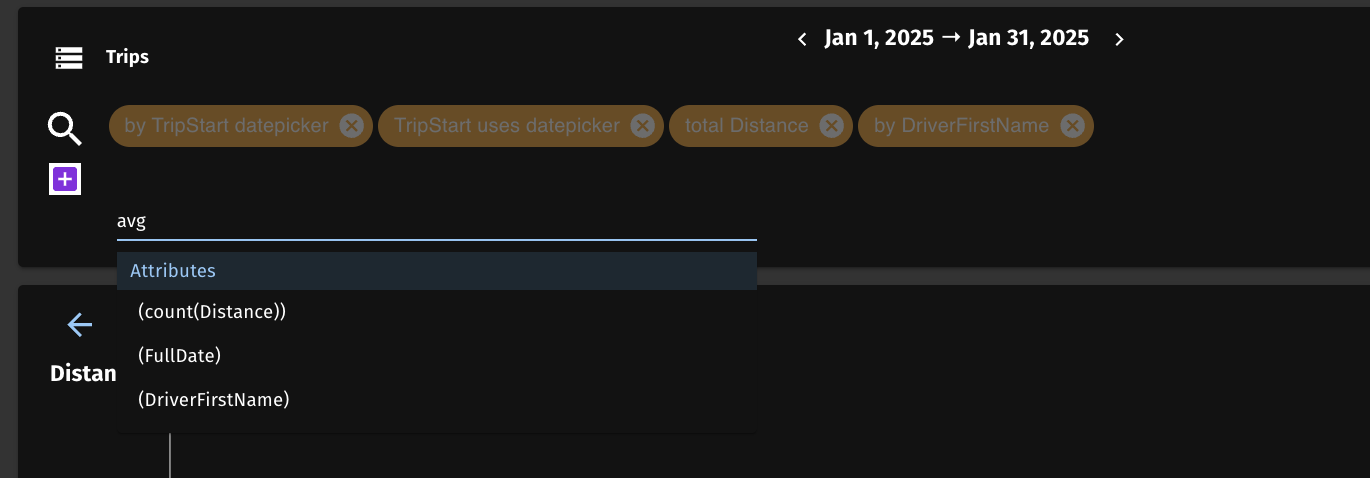
Applied Advanced Query In this image below we can see how the Advanced query looks when it is applied.
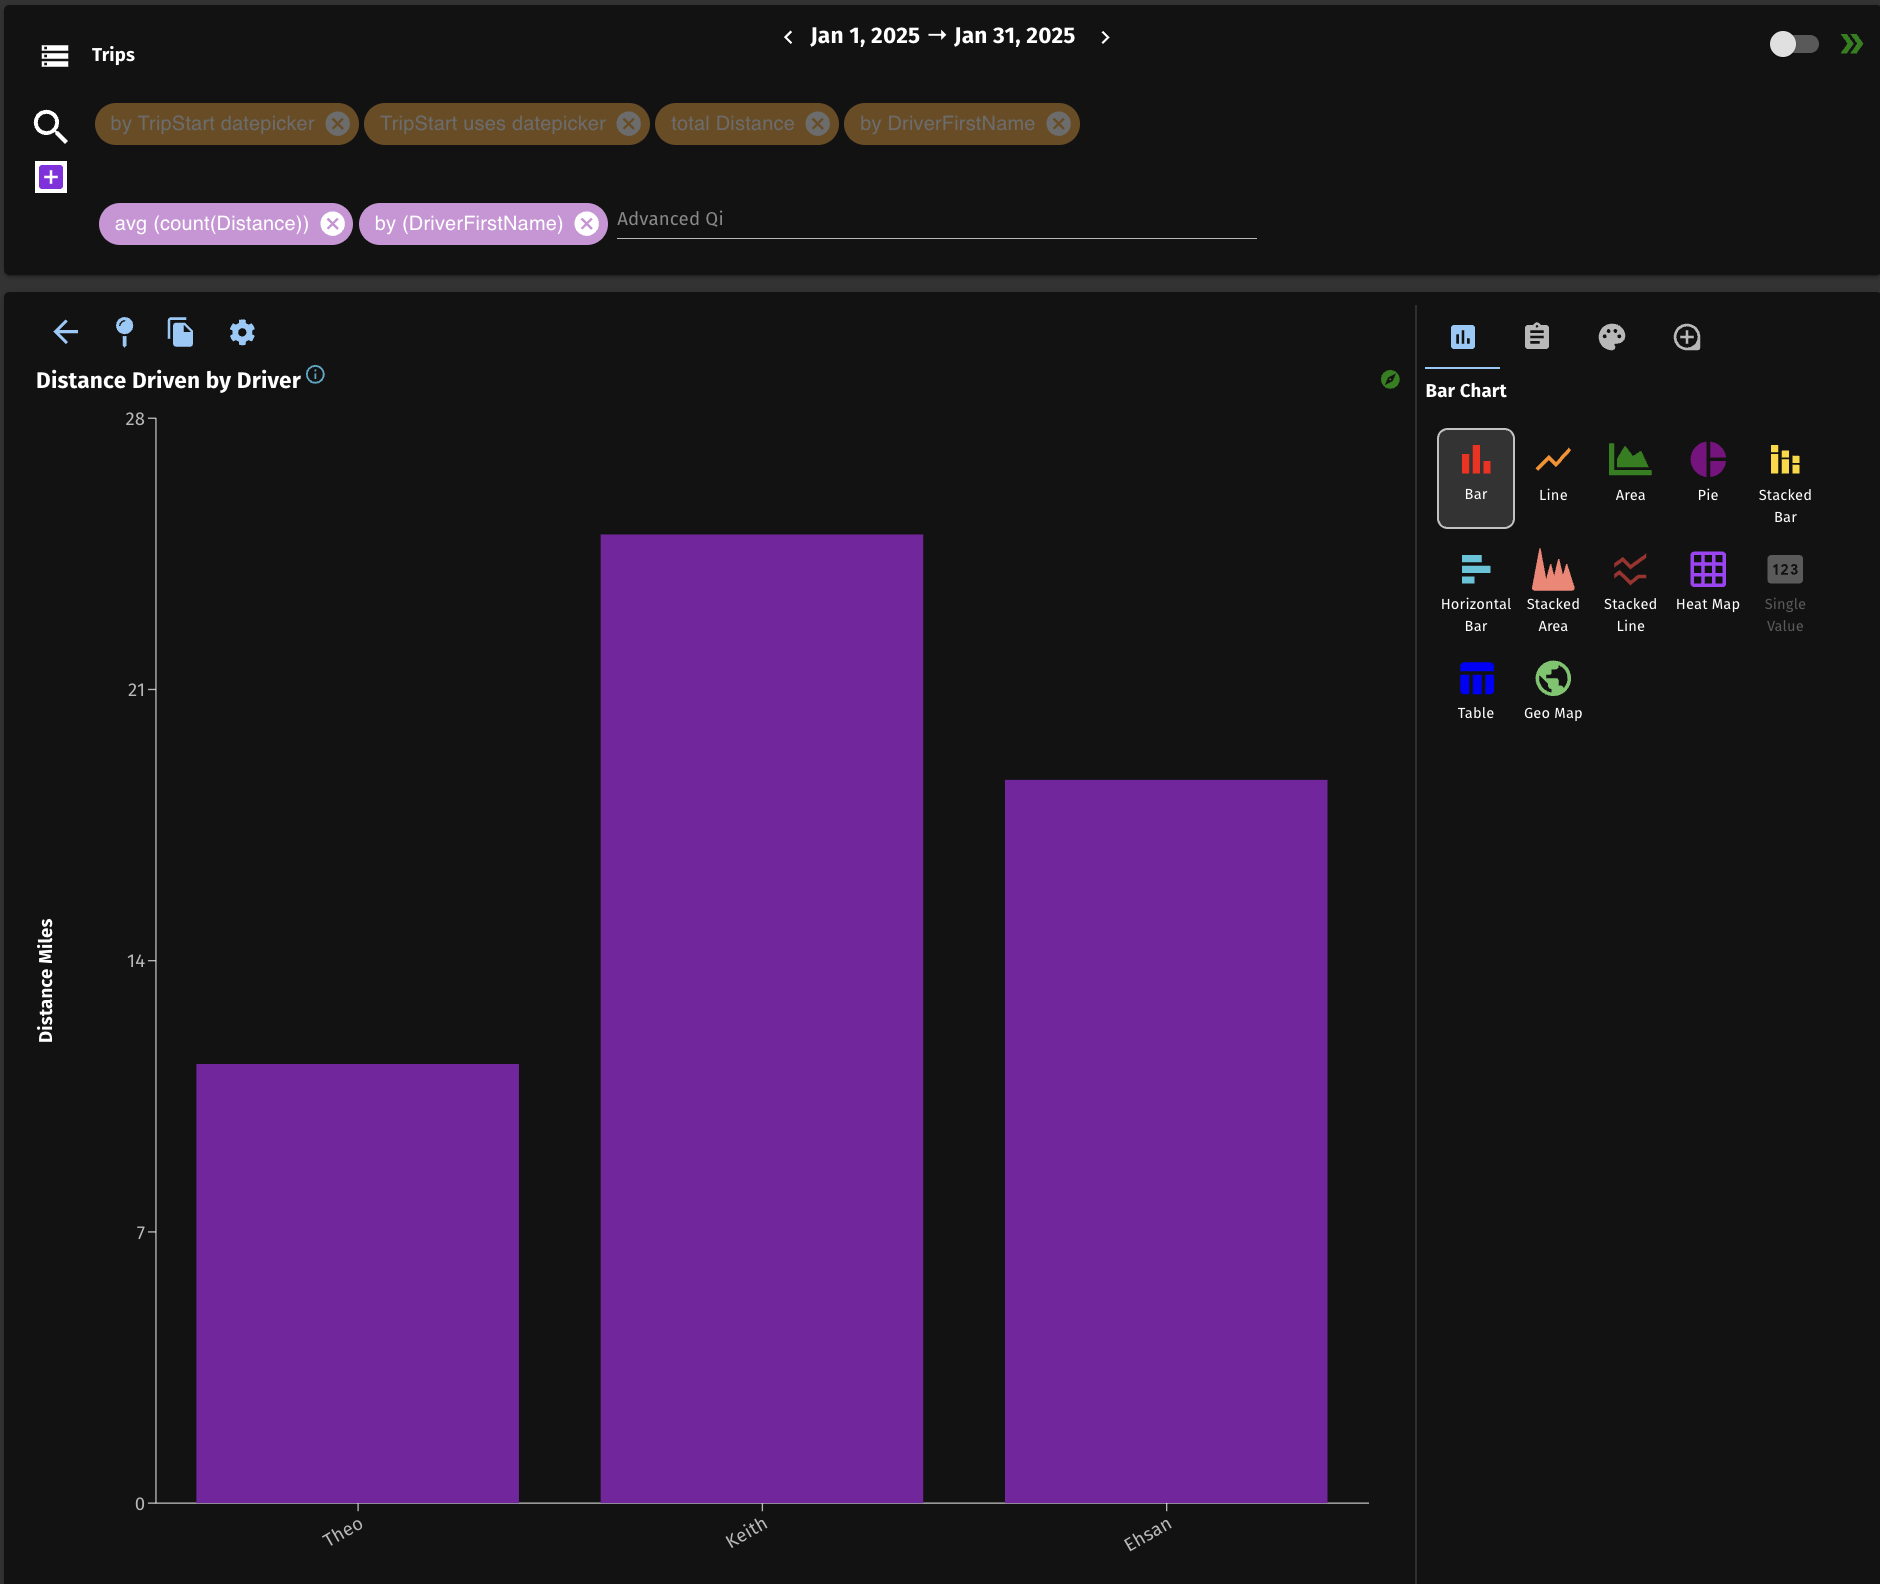
2. Visualization Properties
The Visual properties section is where you can adjust the visualization to your preferences.
The Quick Intelligence screen has made data exploration easy by instantly creating a visualization as soon as you run your question in the search bar. However what appears is simply predetermined defaults. Something quick and easy and very useful for fast data exploration. However, if you are creating a dashboard that needs to be presentable and possibly branded, then you need further control as to what will be displayed. This is the purpose of this section.
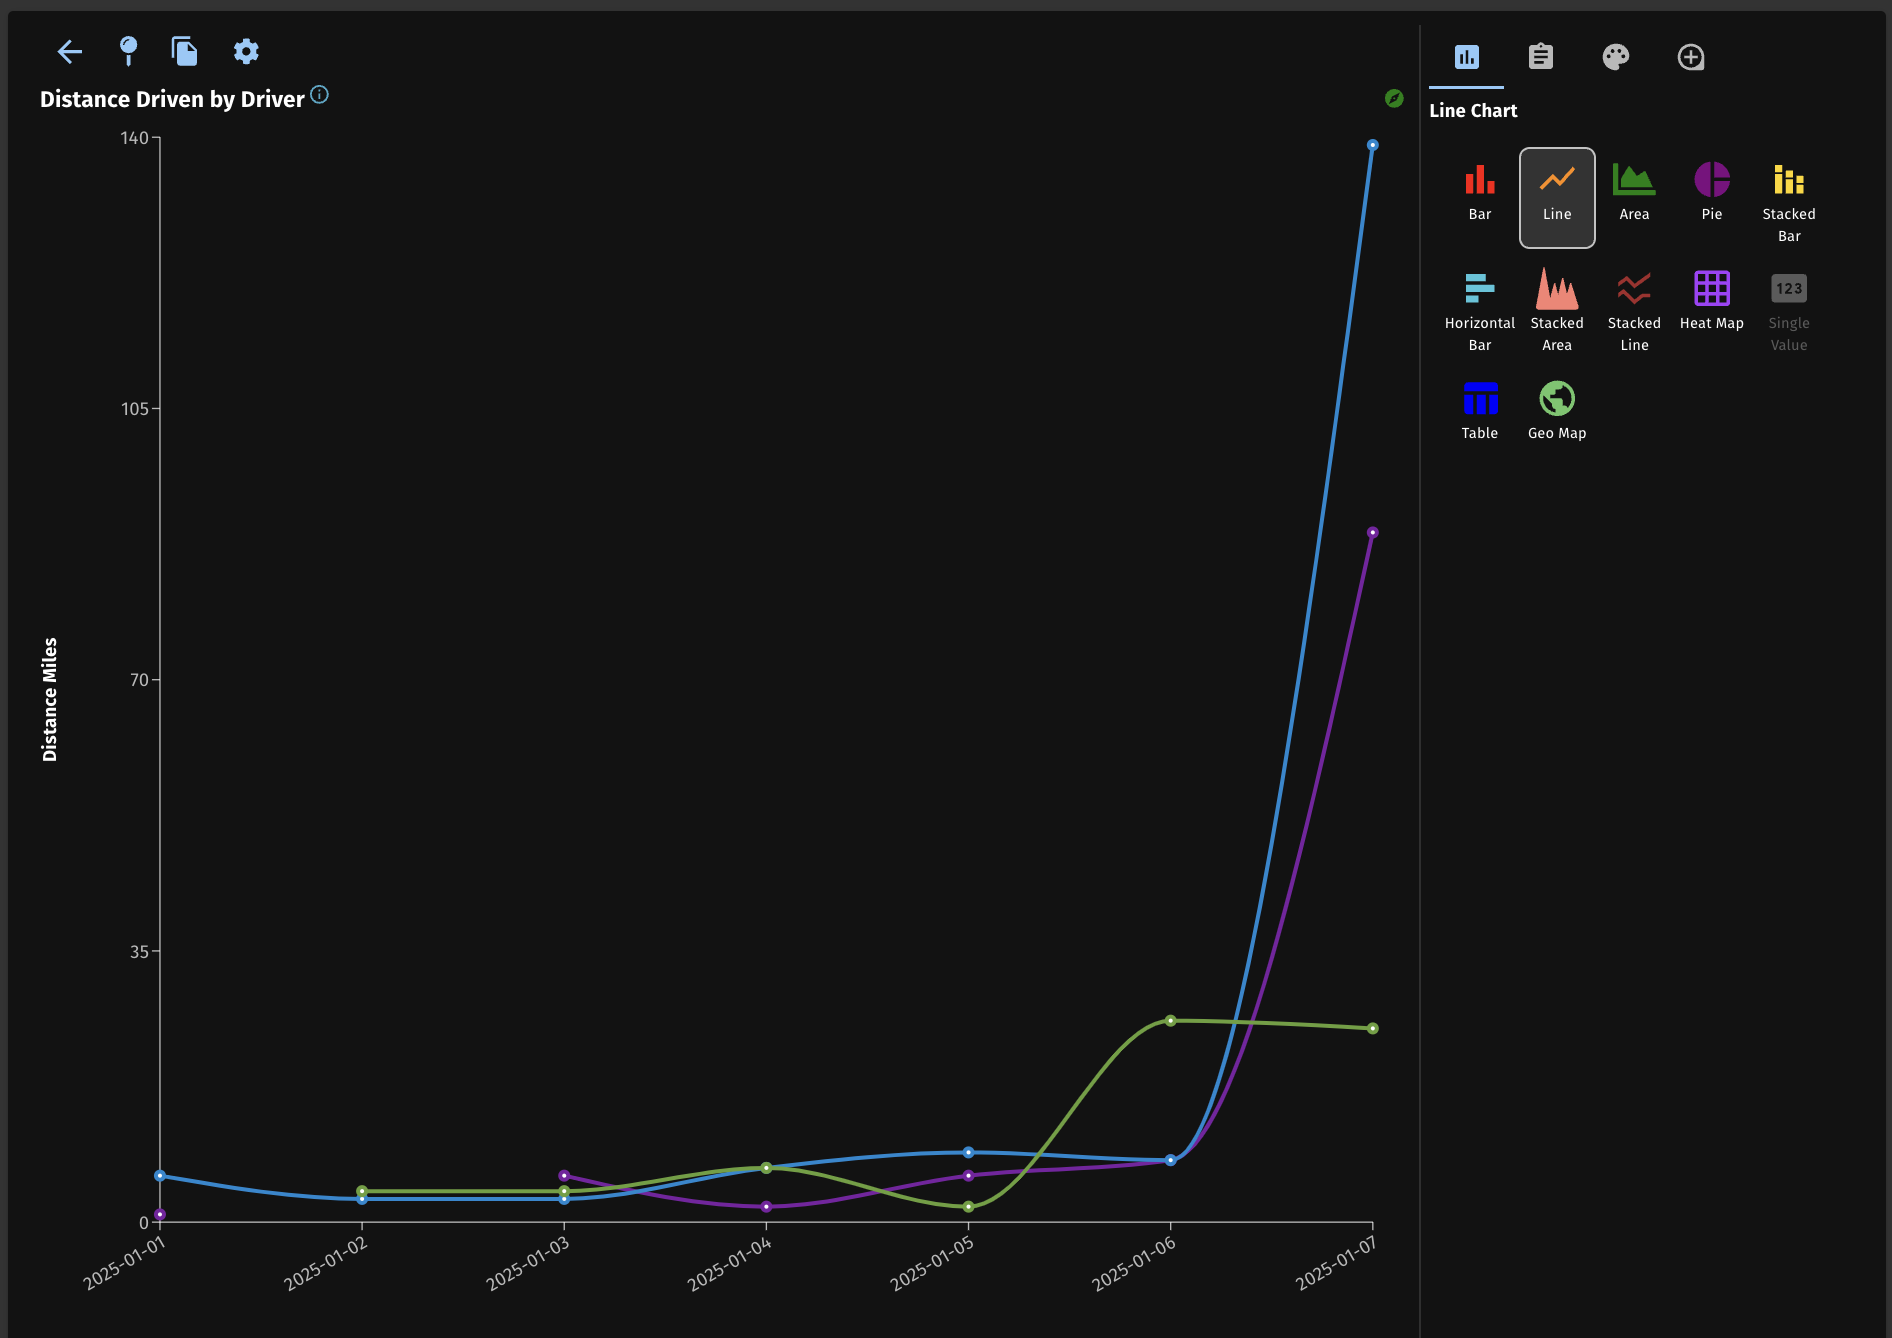
Visualization Graph Selection
In many cases the engine will choose either a bar chart or a table to present your data. Most graphs can only run with one or two groupgys or by statements and one total element. however if you do many of either of these, the returned data won't fit a bar graph. So instead we will still run your question but simply return a table.
If you just enter a single attribute in the search, all the unique values in that attribute will be returned in a table. This is useful to understand what data is in that attribute.
You may not want a bar chart r a table, So the first option in the visualization options will allow you to change the graph type. Only those that match your query will be highlighted in your list. To select a new graph simple select one of the other highlighted graphs that you wish to use.
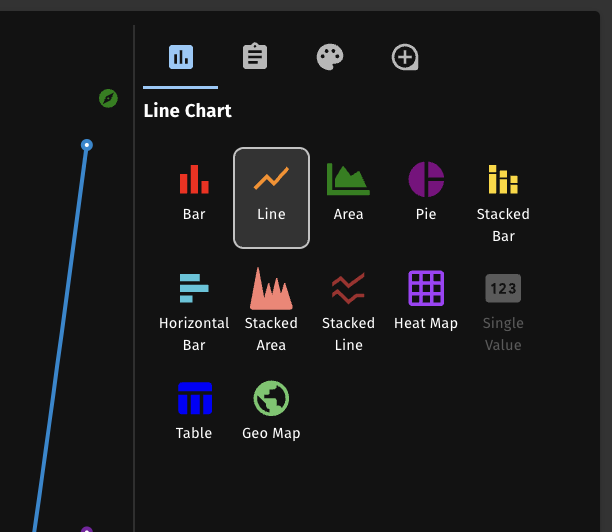
Visualization Axis and Description Configuration
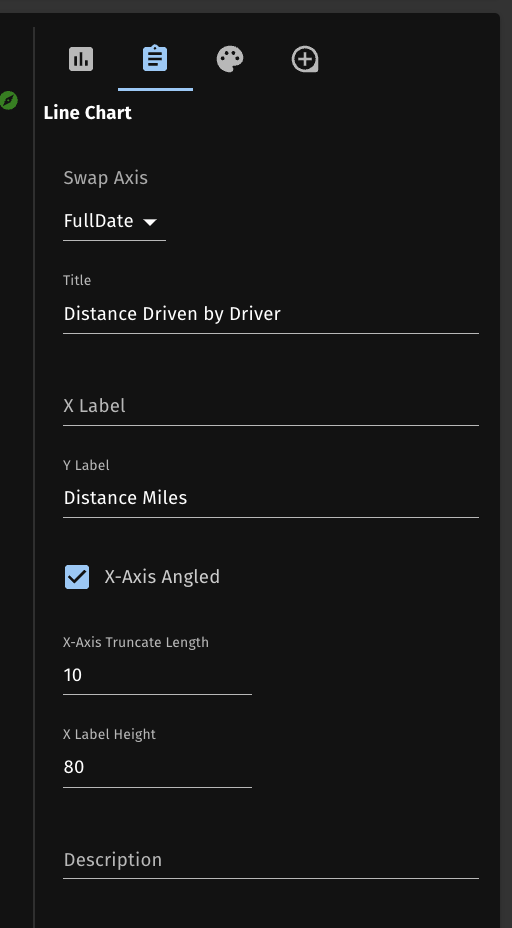
Although the engine generates the visualization, It doesn't assume the labels. So in the section option, you can now add a Label for the over all visualization as well as x and y axis labels. These options will change depending on the type of graph you've seletd.
Visualization Color Adjustments
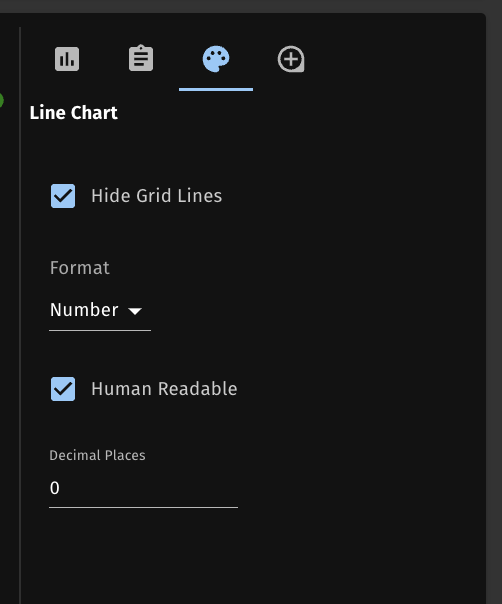
Branding is important. In the third option section you are able to change the colors of your graph. For branding purposes we often find the common hex colour and paste this into the color section for absolute consistency.
In the future we'll be adding common color themes. These will be set at the account level and used as defaults throughout your experience so much of your coloring can be automated. Today we can't easily control muli-series colouring except for in heat maps.
Guided Drilldown Setup
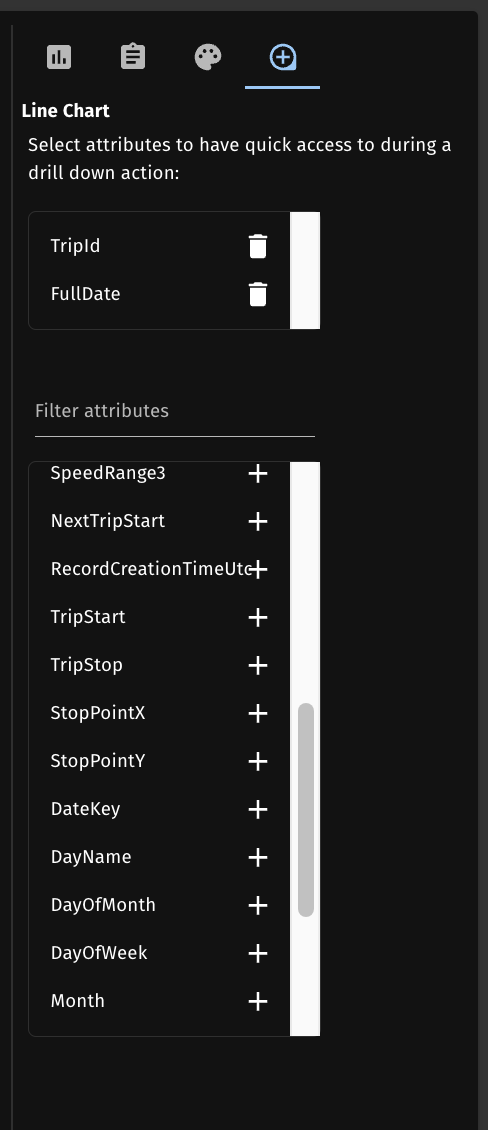
Drilldown is a default capability in any series graphs today. However datasets may have many attributes to select from causing that burden of too many options and not really knowing where to drill too for the average user. In these situations you may want to guide your users to natural drill down paths, without limiting them.
The Guided drill down option allows for this in your dashboards. Be selecting attributes in guided drilldown, the end user will be presented with these options at the top of a list. They will be highlighted for easy visual impact, guiding the user to select one of these. Other attributes will still be available but your users will thank you for the easy smarter access.
Menu Goback, Update, Copy, Formatting toggle
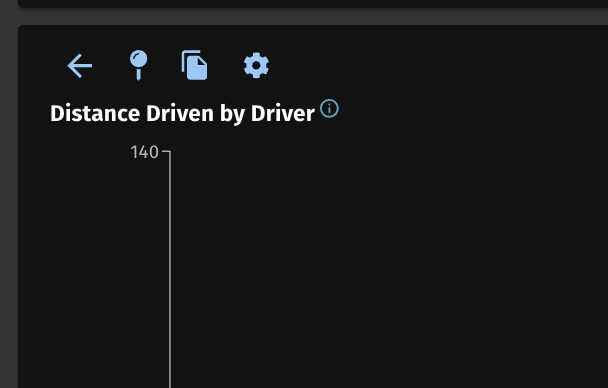
Now that you're done with your visualization you're going to want to save it somewhere. The icons in the top right of the visualization section will help you with this. These options may change depending on the context. for instance is you've started from scratch, then you won't see the copy icon. If you're editing an existing visualization, the meaning of the Pin will change.
On creating from scratch, the Pin will save your visualization but prompt you to either pick an existing dashboard, or create a new one.
If editing an existing visualisation from a dashboard, the pin will simply save your edits to the same place you started at.
However if you want to save you changes to another dashboard, or maybe you've created another visualization based on an existing one but don't want to change the original, you can copy down to the same dash board. it's your choice.
If you are in editting an existing visualization (aka kpi or QI), the back arrow will send you back to that dashboard (but won't save automatically).
The gear icon will simply hide or show the visualization options in this section.
3. Suggestions
Keyword Reference Section
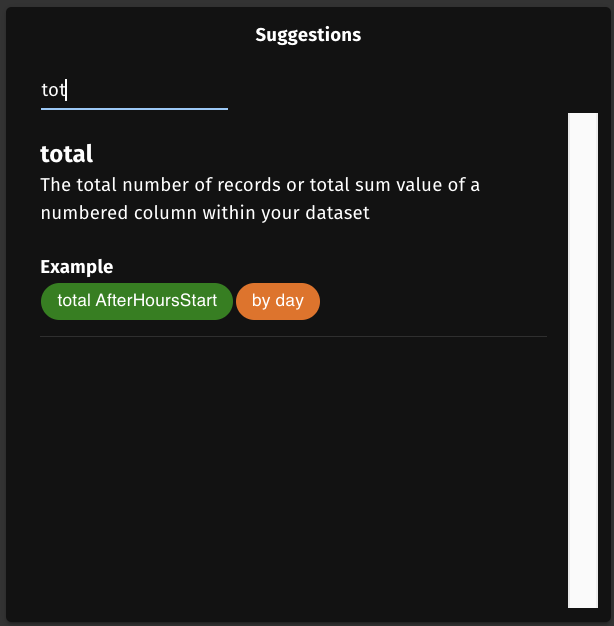
The keyword section is on the top right of the Quick Intelligence Screen. This is simply for reference as you're starting to learn this screen. It's simply a list of key words currently available in the search bar. You can filter for the key word you're looking for and it will show you an example of how to use that key word. The orange tokens show you how the key word is structured in it's own token, but we've also added in other green tokens to provide an example of how a ful query might be conwtructed. All of these suggestions should be related to the dataset you are working in for ease of understanding.
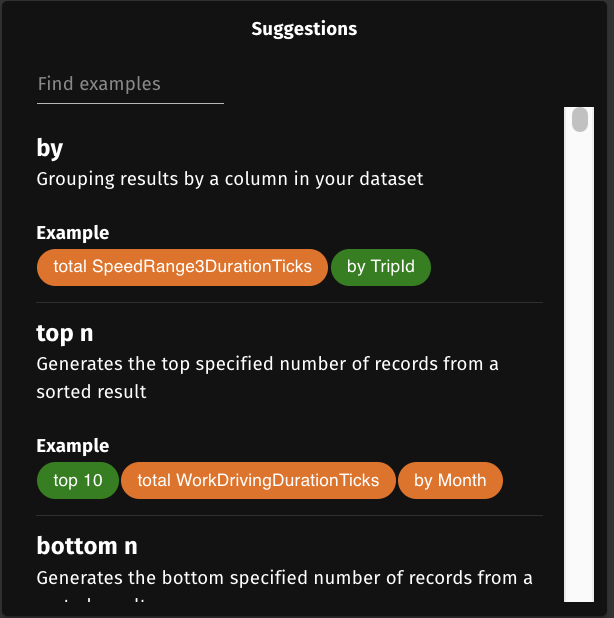
Filtering for specific keywords
You can either scroll through the key words or start typing the key work in the field provided. For instance, typeing in [Between] will show the example for Between.
4. Data Explorer
The Data Exporer is found in the bottom right section of the Quick Intelligence screen. this is simply for reference and is not functional today.
Because the search bar is very easy to use with the type ahead, we've delayed implementing drag and drop or selection for this reference section.
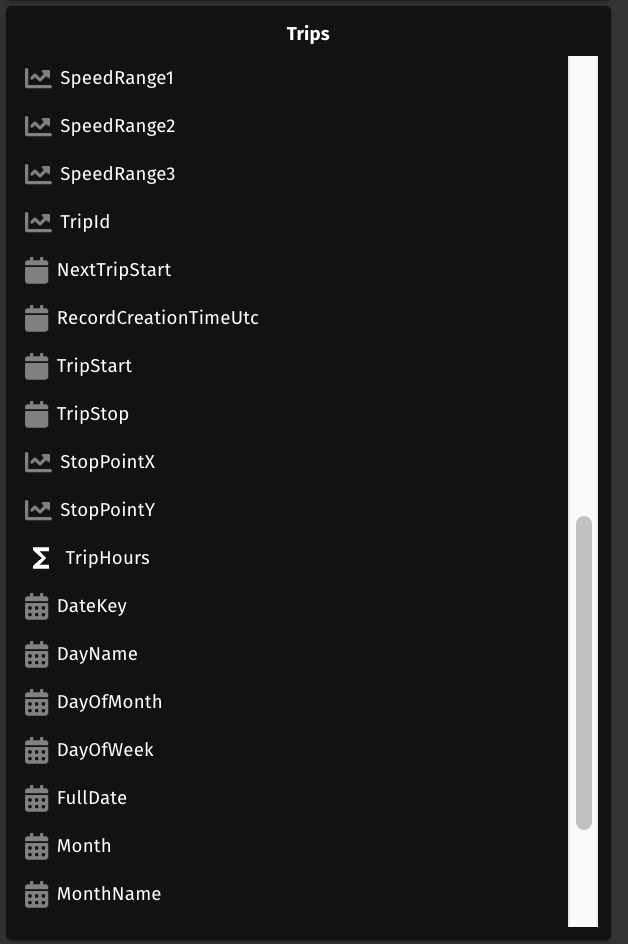
This section is based on the dataset currently selected and will show you all the atributes you can use, including any in the date dimension. they are ordered by the type of attribute first.
Dataset Attribute Reference Showing Dimensions
You will see measures at the top (Measures are attribute you can Sum, avg etc), Dimensions are shown next (These attributes are typically nouns that describe things, you can Count these, filter by these or group by these etc.)
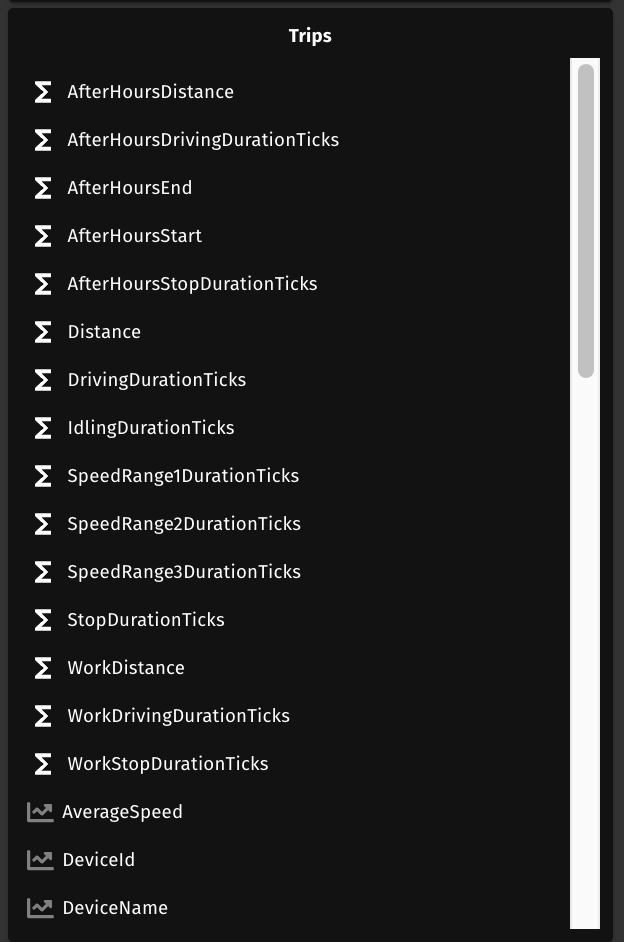
Dataset Attribute Reference showing Dates.
After Dimensions you will Dates in the dataset, then finally Time attributes from the Time dimension.
