Dashboards
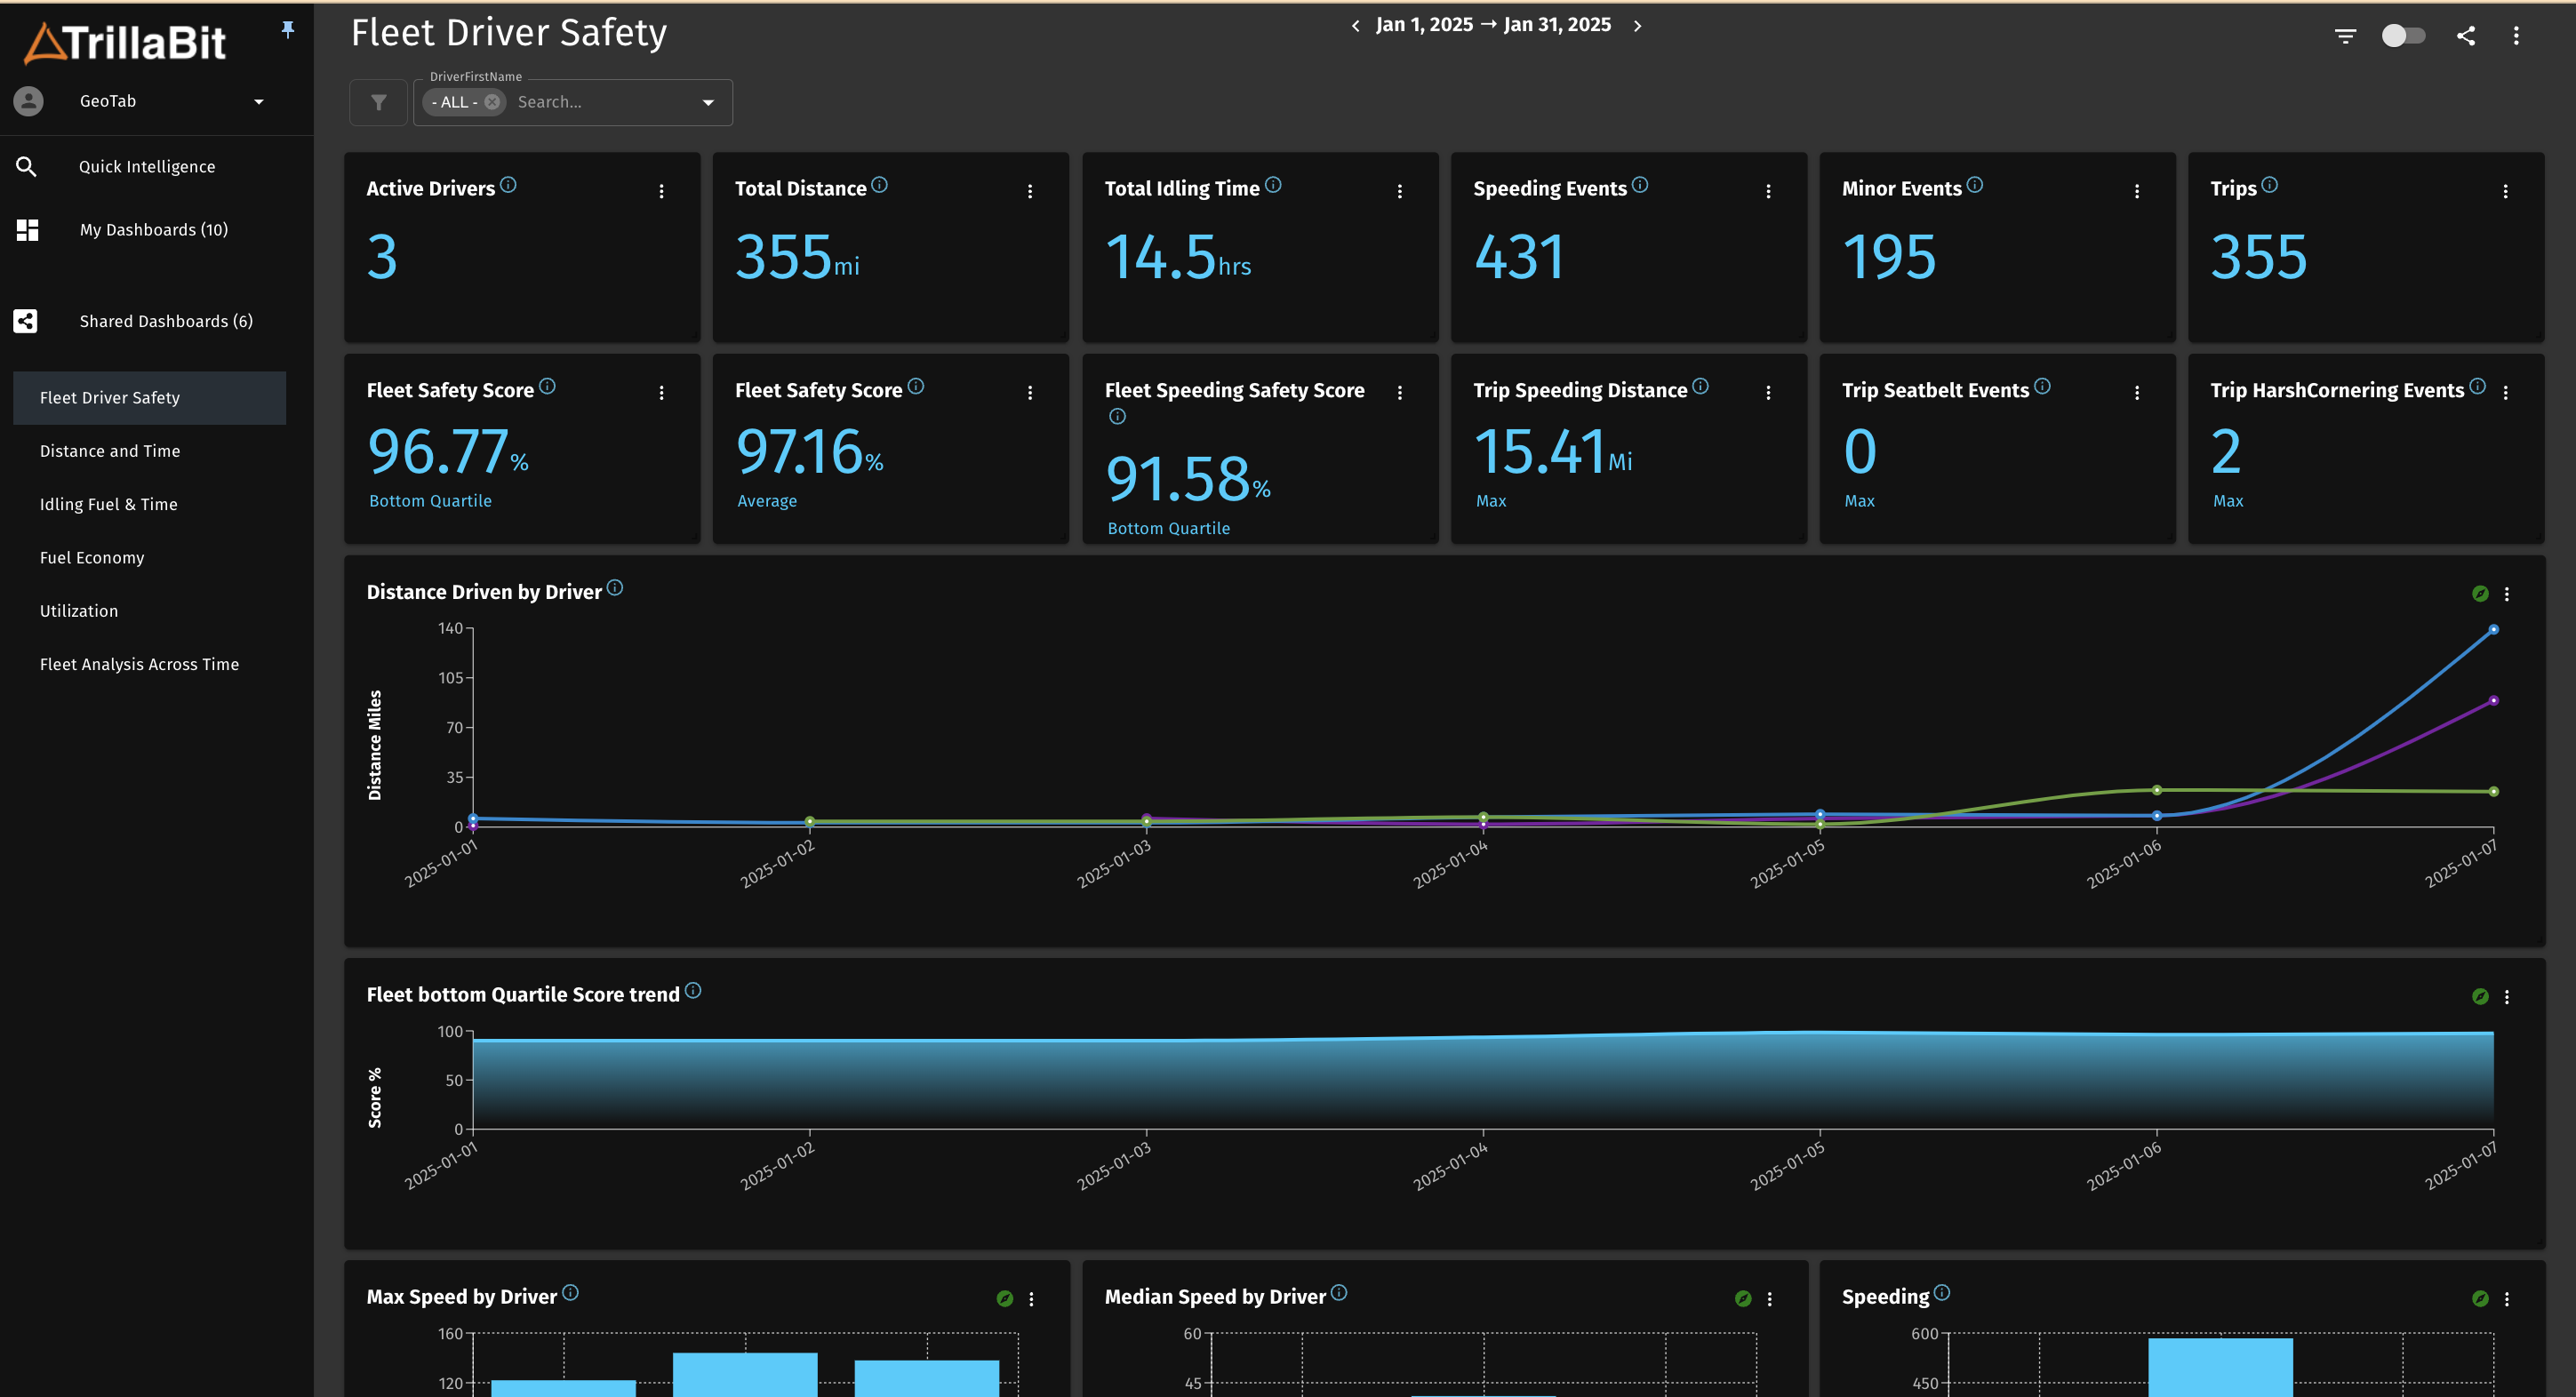
Dashboards are where you can get business insights from your data. They have a title and a collection of data visualizations grouped together to support decision making. Dashboards are created by users at any level using the Quick Intelligence Designer.
Ownership and Data Access
The Owner of a dashboard is user who creates it. Only Owners and Admins can modify dashboards. However any user can copy from any dashboard and create their own dashboard (becoming the owner of their own dashboard.
Even when dashboards are shared. Data is secured to the user. You can only see data that you are allowed to see in regardless of the dashboard. For instance if VP has access to all company data, you only have access to your branch data. When the VP creates a dashboard containing all company data and shares this with you. You will only see your branch data.
Data security is separated from dashboard access in Quick Intelligence. This allows Domain level admins to create dashboards at the domain level and share them down to all workspaces and clients. When opening these dashboards in a workspace, the user will only see the data they have access to.
Formatting
Formatting dashboards is simple, fast and LIVE! As the Owner of a dashboard you and Admins are the only users able to modify it. Other users can view it and interact with it, changing the time or drilling into visualizations. But you have the most control. Just be aware that all changes are live! You don't need to enter into an edit mode. This is optimistic editing. If you resize or move a visualization, other users with access to the dashboard, will see this change the instant they refresh their dashboard.
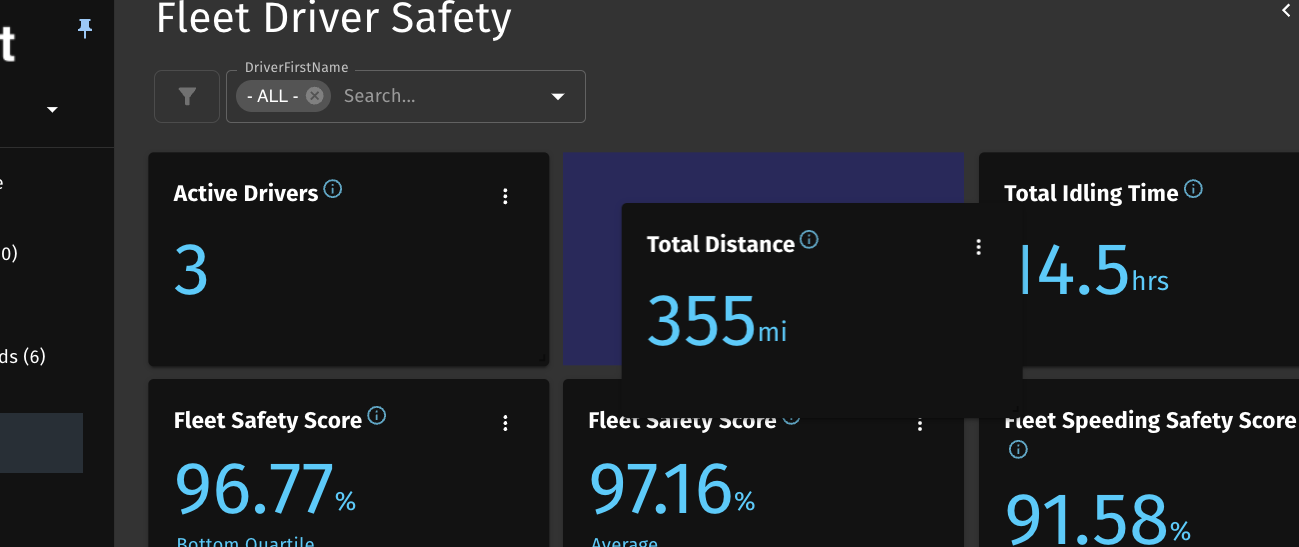
1) Drag and drop
Editting is super simple. If you want to reposition a viaulization, simply drag it and drop it where you want it. If you want to move it up or down to the dashboard which maybe off screen, you may need to do it in a few steps. adjust your screen to bring that section into view and move it again. You'll see how other visualizations just move around where you're dragging. It's as simple as that.
2) Sizing
Often when visualizations are added to a dashboard, they're dropped at the bottom of it automatically and the size is defaulted. To resize your visualization, hover the cursor over the bottom right corner of the widget until you see the direction arrow show. then click and drag the corner to resize. when you let go, it will fall into specific preset sizes. You'll get the hang of this once you do it a few times. Visualizations can get only so small and so big, so play with it and this will become apparent as well.
Scroll Loading
Scroll loading is in place primarily for performance. Because we don't limit the number of visualizations/kpis/widgets on a dashboard, you can load it with a lot of graphs. Each one of these needs to be executes with data and get rendered on the board. Many of these might not fit in a single screen, so you need to scroll down to see them. As you scroll you will notice that the visualizations will load as you go. This means visualizations will only be executed for what's on the screen at the time. If we were to refresh the whole dashboard each time... well it's too heavy on the backend.
Visualizations
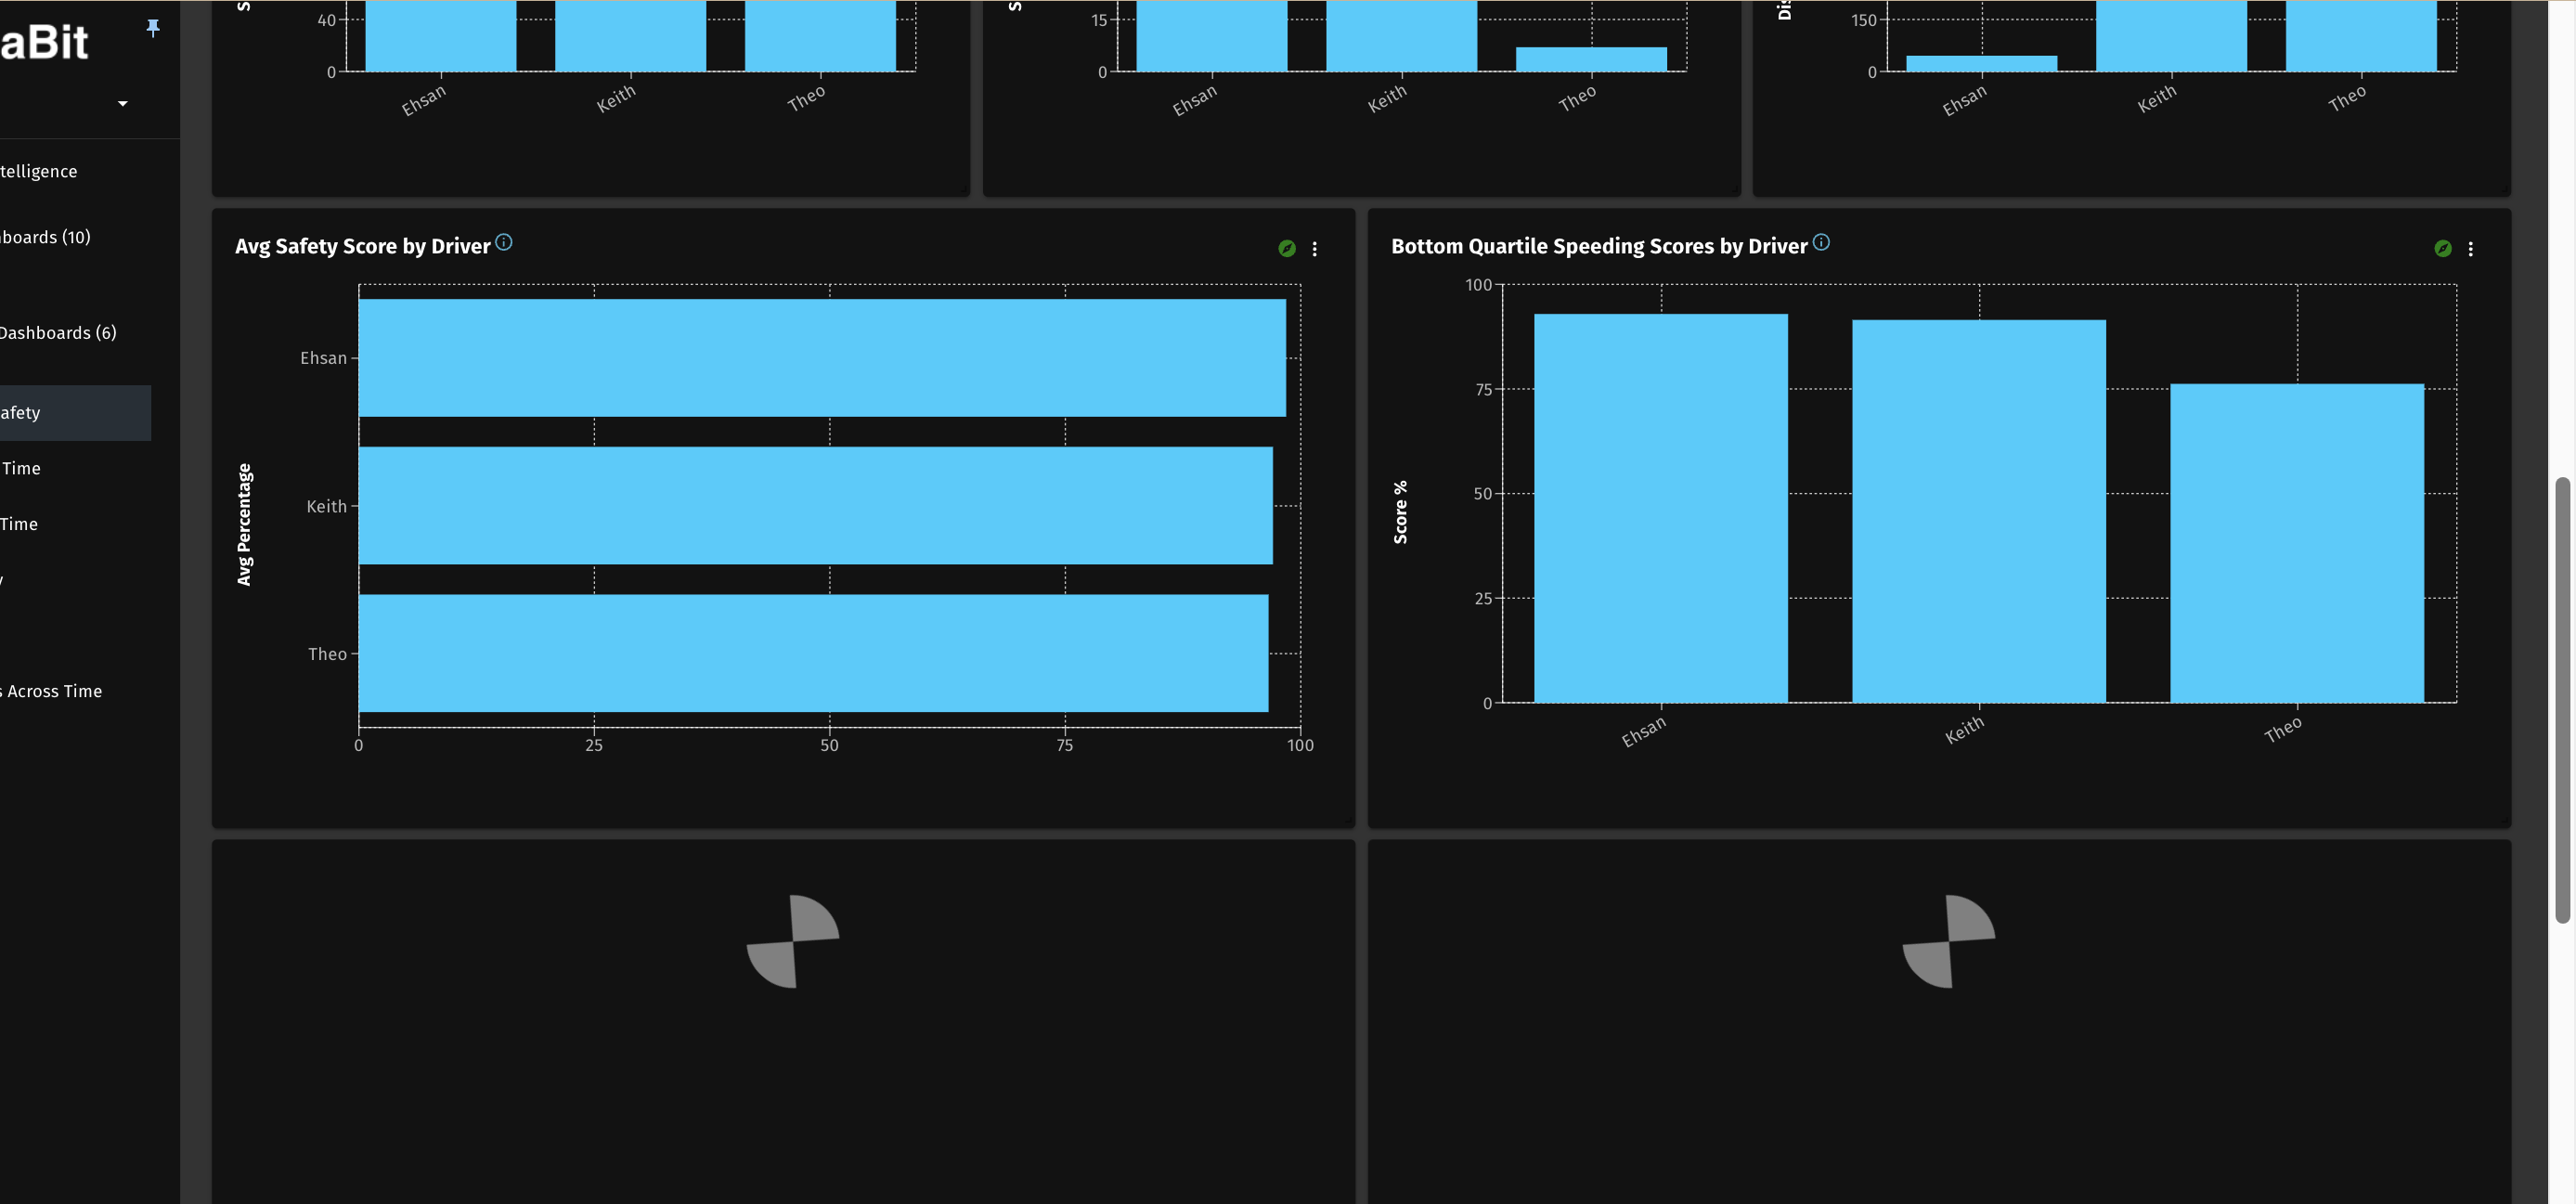
Visualizations can be single KPIs, charts, maps or tables. At times we call them widgets. Visualizations a built in the Quick Intelligence screen, or copied from other dashboards, but here we will cover the common features of these as they resolve in dashboards.
Cards are far more advanced. As Trillabit builds our new analytic features, we will extend our library of graphs, but also Cards. Cards are combinations of similar analytics. They may contain A numeric value but also a comparison value and possibly a graph. we will provide many combinations... but the best part! The way we've designed this, it will be easy for end users to create cards in our quick intelligence designer. For instance based on a single search, you may be able to just select a card, and it will automatically create the main value, comparison and graph. We're very excited about this esy to user, powerful feature.
1) Editing
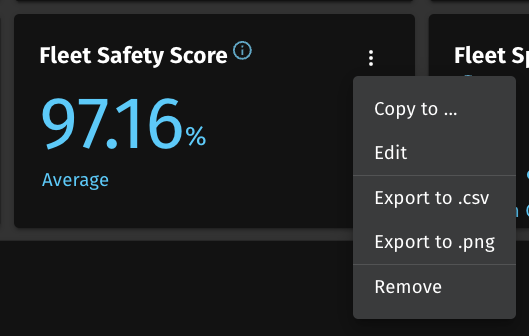
Any of the visualizations can be edited with their ... menu. We will discuss editing visualizations in the Quick Intelligence Designer section. When selecting Edit from the elipses menu, you will automatically be sent to the Quick Intelligence scren where you can Edit this visualization, even if you're not the owner.
What does this mean? Allowing any user to edit any visualization allows them to expore and play with the data more extensively. Can drill down there as well. (sometimes this is easy to see more, including raw data because there's more realestate in the Quick Intelligence screen). But this doesn't mean the user is changing the original dashboard version yet. When moved to the quick intelligence screen, the user can play and cahnge all they want without efffecting the original dashboard visualization. from here, the user can play, and then abandon all changes and go back to the dashboard. Or! the User can create their own version of this by saving it to a dashboard they do own. The Original visualization only changes when it is purposely saved back to the original dashboard, and it's only the Owner or Admins that are able to do this.
A new version could also be copied back to the original dashboard as a new visualization, without changing the original. but we'll cover this in the Quick Intelligence screen.
2) Copying
It's quite often that users may want to copy an existing visualization elsewhere, aka to another dashboard. In an older version you needed to Edit the visualization, goto the Quick Intelligence screen and then copy from there. but to improve efficiency of this, we added a simple copy to... option in the visualization ...
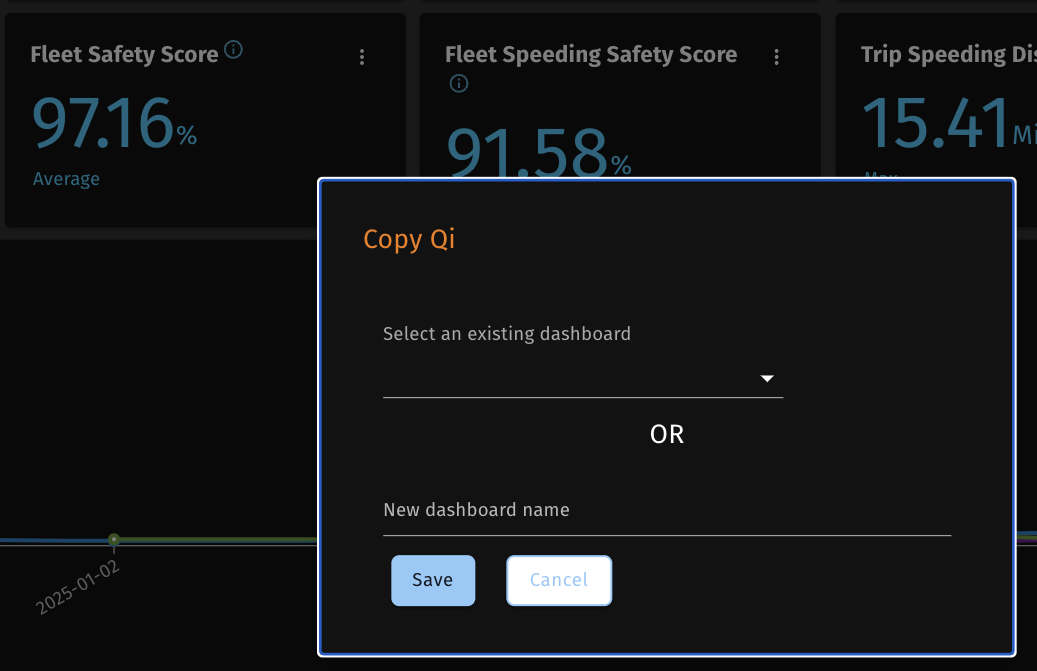
When copy to... is selected, a prompt will pop up. In this prompt you can either create a new dashboard on the fly or select from a list of dashboards you already own, to copy it to. when this action is completed, the visualization will be automatically copied to the new or existing dashboard and appended to the bottom, for you to format.
It's that simple.
3) Exporting
As much as we try to provide flexibility with sharing dashboards and ease of use in the platform, we understand the users may want to share what they're seeing elsewhere. Or you may also want to utilize the data or visuals in other tools like Excel or Power point. So we've provided this flexibility via export.
exporting functions are found in the ... menu of the visualization. and this may change depending on the mode you're in. If you're viewing a graph, you will have export options of png, svg and csv. Png and Svg will produce images of the graph you're viewing in those formats. They will be automatically downloaded via your local browser, where you are able to use in your power point, or e-mail to your colleague. Csv in this mode will export and download the aggregated graph data in a table format into.... you guessed it... a csv format. This will allow you to import or use that data in excel or where you wish.
In Drill down mode, the export options will only be to csv. the data downloaded in this mode will be the raw record data at it's lowest grain before aggregation. this is often a wide record with many attributes, which can be configured in the Dataset metadata section, covered in the Admin part of this user guide.
4) Information
In most Visualizations you may see an information icon beside the title. This is to provide easier access to more information about this visualization. Different information is also provided depending on your role.
For instance a regular end user may only see a prepared description of what this visualization is or means. However If you are an Admin, you may see the actual query definition and the originating dataset name.
This information allows for convenience for users to either understand what they're looking at or for admins to assess consistency or troubleshooting visualization definitions within a dashboard.
5) Remove
This maybe obvious, but sometimes you want to remove visualizations for a dashboard. This is it. This is th option for that. Select this option, and this visualization gets deleted from the dashboard.
Deletes are currently permanent. Only Owners and Admins can delete. but when it's gone , it's gone. you can't undo this today. (likely in the future because after all, people make mistakes). So be aware, and if you're unsure, copy it to another dashboard first before removing it. A copy is a copy and it doesn't refer to the original anymore, so deleting one, won't affect the other.
Drill-down
By clicking on any items in the visualization, you can either see a further breakdown of data or drill-down into the underlying data. Drill-down is only available in chart visualizations today.
Today Drill-down in not available in Single value widgets, Tables or Maps. this may change in the near future.
However something cool in Tables. If your data contains a urls, clicking on a url will open it in a new tab automatically. Very useful if you want to provide further information, documentation or links to relative websites in your dashboard with just data.
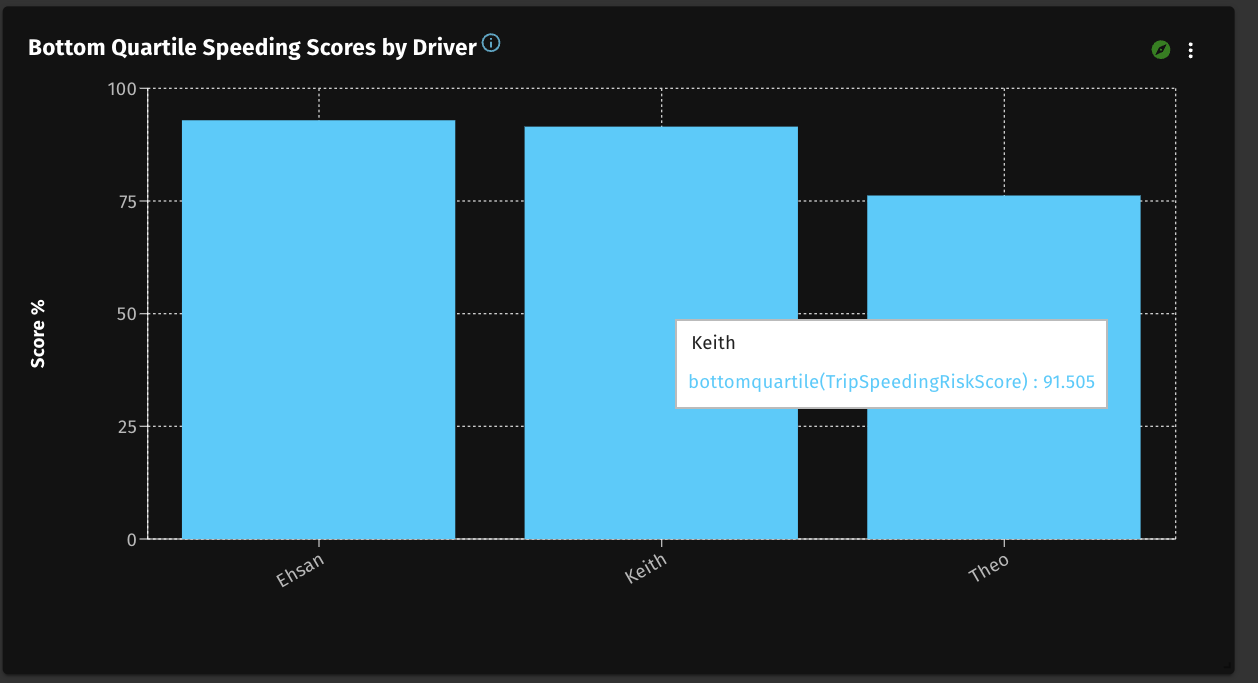
1) Multi-Series Charts
Many of the charts can display multi-series. In a line chart, this may appear as multipule lines. In a bar chart this may appear as stacked bars or groups of bars per category listed at the bottom of the chart.
For such graphs, It only takes one click to drill-down. Changing the Graph to a single series filtering by the point you had clicked on.
For example: If you have a chart showing Sales by product by month for a year. For each product there will be a line (Series). Along the bottom of the chart you may show the total per month. when you click in the chart, your client would be based on the month you clicked on. This action will filter the Graph by that month and re-present all the products for that month. The bottom of the graph will now show the individual product, and the values in the graph will pertain to the month you selected. You contine drilling into products to other levels from here.
2) Single Series Charts
Single Series are often represented with a single graphed value per grouped item at the bottom. Total sales by product. Products would show at the bottom and the sales values in the graph.
When clicking on a chart like this, we know what element you're clicking on. In this case it would be a product. From here, we don't know where you want to go. so you need to tell us. A window will pop up for you to select how you want to group the next visualization. In this case we know you want to drill into this particualr product, but how? by month? by Type? etc... if you select month, the next visualization will filter the data by the product selected and group it by month. Now you will see sales by month for that particular product. From here you may continue to drill into a month and select a new attribute to group by.
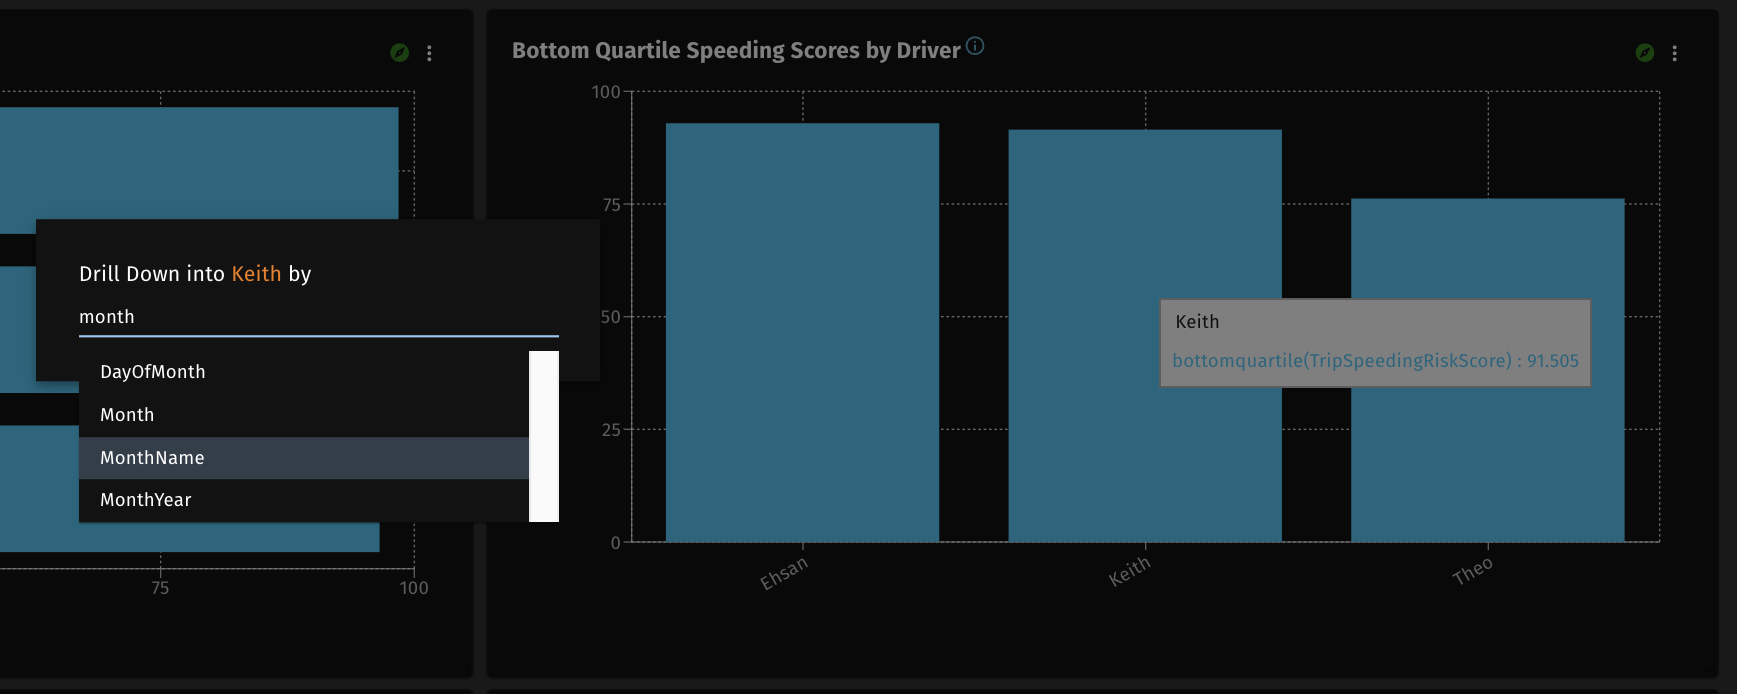
For creaters of the kpi, you may also guide users on what to select using the drill-down guide. there may be many attributes to drill into, depending on the dataset, but only few may make good sense for your kpi. So you may want to guide th user to select those attributes that makes the most sense. We'll cover this in the Quick Intelligenct Screen
3) Drill-down Breadcrumb Trail
Each time you drill-down into a chart, you are making a selection that filters the graph and formulates a new grouping. If you do this several times, you might get lost, or want to back track and do something different. After all this is about drilling into interesting things and discovering the source of your success or issue.
To know where you've been and to back track, simply look to the breadcrumb trail above. In each case it will show the new grouping you've selected. and if you hover over the trail, you can see thee filters applied each time. To go back, just slect the part of the trail you wish to navigate to and try again. Or even just reset to the original from the trail.

4) Viewing Raw Data with the Breadcrumb Trail
A graph is always an aggregation and summary to some level. But Quick Intelligence allows you to get right down to raw data for the ultimate analysis. This is only available via drill-down, so you need to drill-down at least once. When the breadcrumb trail appears, the right most element allows you switch views. when the right most element is clicked, the graph will imeadiately change to a table view with full raw, no-aggregated records available right in the dashboard. You can scroll right and left to see all attributes and or course up and down for more records. What is shown here is configured by your admin in the datasets section which we will cover under metadata configuration.
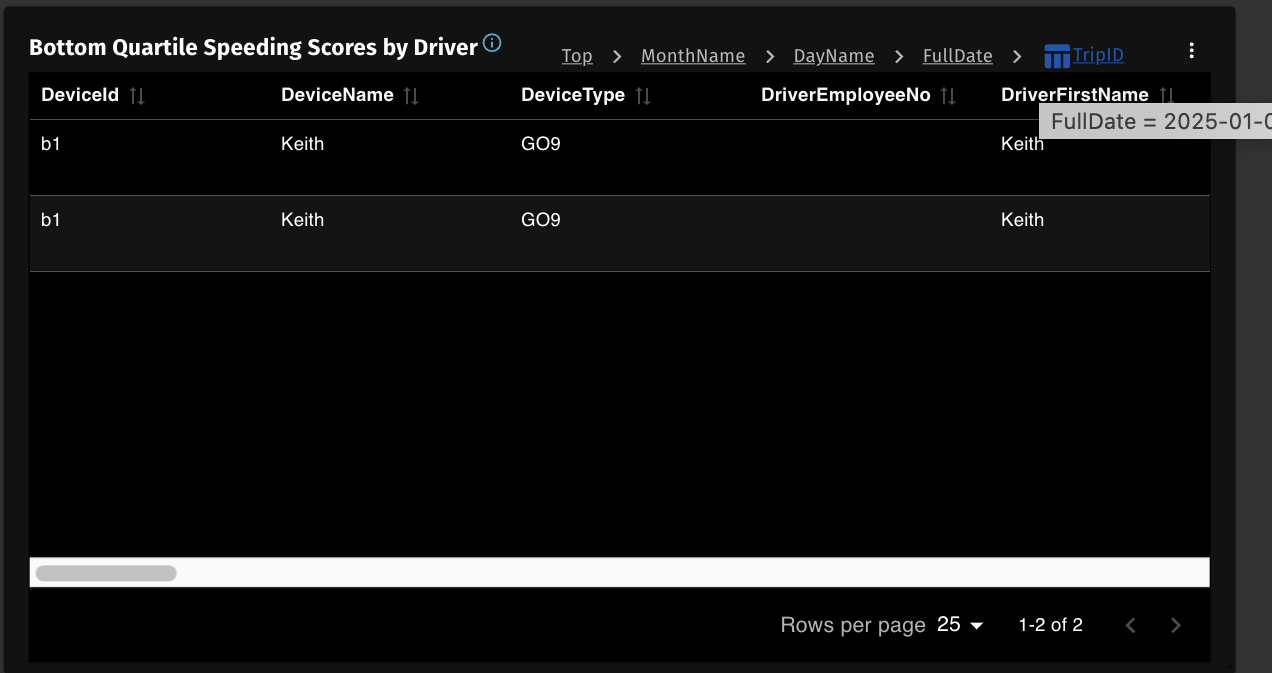
So data can be a monster. Since analytics is often an aggregation of vast amounts of data down to single consummable values, we don't want to let users accidentally flip this raw switch and be flooded data they (or the system) can't handle. So we have a fairly low limit as to the number of records that can be shown here. You can't use this to down load a ton of data. TrillaBit will provide alternative methods for that very different usecase. But we do allow users to download raw data to csv, through their browser. this allows them to open it in excel for other purposes.
5) Exporting Raw Data from DrillDown
We will cover other functions in the ... in the right hand corner of the widget. When you're in drill-down mode viewing raw data you may want to export this, either to send to someone not in the system or to perform further analysis in a spreadsheet. Regardless, when you click the ... in this mode you will see export to csv. This will export and download the raw data you are viewing to a csv file on your local machine.
When in graph mode you will also see export to csv in the ... However in the graph mode you will be exporting the aggregated graph data. This will be covered under Visualizations - Exporting above.
DatePicker
As in science time is a unique dimension and always has special consideration. It's such a common dimension that it requires a dedicated feature to navigate. during exploration or analysis, we are often comparing elements over time or visualizing trends in different ways over time to get an understanding of how things are occuring, in hopes of anticipating what's next or understanding patterns incase they occur again. for Quick Intelligence, this is our date picker. Shown at the top of the dashboard if at least one visualization on that dash is configured to utilize it. (we'll talk about that more in the Quick Intelligence screen)

An end user can manipulate this datepicker as they wish, enabling them to explore their data over time. This is all dynamic and very easy to use. When values in the date picker change, every visualization in the dashboard will change if it is configured to use each element of the date picker (we'll cover this more in the Quick Intelligence screen how this configuration works)
For Fast manipulation, the arrows on either side of the collapsed date pick allow you to jump periods quickly. For more detailed changes, click on the date picker to see the popup.
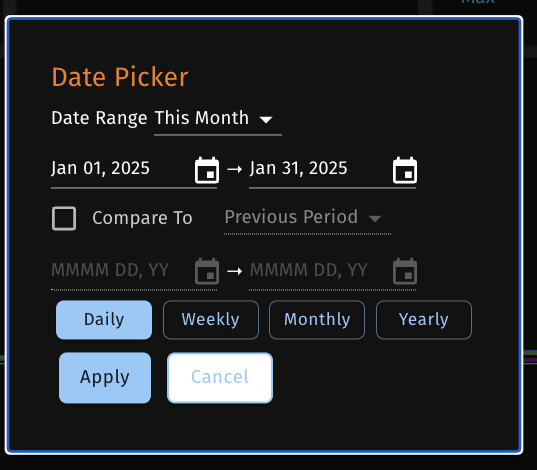
1) Date Range
Pretty much everything is scoped and aggregated within a select period of time. This date range utilizes the current day and works from there. i.e. this month, last week, last 3 months, etc... are all periods of time based on the current date. The period options here are preset by TrillaBit today.
2) Custom Date
the Custom date selector essentially overrides the date range. the custom date seletion is not bound by today's date. You may pick any date range with this.
Today quick intelligence is built to smartly work with live data. Dashboards date ranges are working from the current date because our current date is always changing. As we move through time, the dashboard is moving with the data. Today is actually today, and everything is referenced from there. if using a custom date range in the dashboard default section, this date range will remain static, simply because it's not based on the current date. the values in the dashbord will remain static until it is changed again. Only Owners and Admin can modify Dashboard defaults (covered later in this user guide).
3) Compare Period
The Compare period is a very recent feature added in 2025. This feature is a preliminary feature to the new Analytic Cards. This date offers an alternative date for the dashboard, often used for comparison. For instance if the Date range in the date picker is set to this month, then the compare range maybe set to Previous month. Some visualizations maybe configured only for this compare date, allowing you to have one kpi for the current period, beside another kpi for the previous period. As you change your Date picker date range, the comparison periold will adjust on the fly. For instance if the default range was this month, and the end user changed it to this year for a bigger picture, the comparison range can remain as Prvious period, but that previous period has now changed from last month to last year in relation to the main date range.
4) Compare Custom Period
The custom comparison period is much like the main custom date range. It allows the user to create a specific comparison period, which can be anything. However note again, that this is a static reference and will not change in reference to the main date picker date range.
5) Grain
The grain refers to the aggreagation level of time. For instance if a visualization has a long range like a year, you can group the data within that year, by day, week, month, year... if it's many years. We've allowed this type of grouping to be dynamic for time. This will be explained in the Quick Intelligence screen how thi configuration will be applied.
Suffice to say that if visualizations are configured to use this element of the date picker, then they will change in relation to what is selected in the date picker.
Currently we don't keep tabs on the date range as relative to the grain. Therefore, if the user selects a range of this week, and then selects the grain of a month. The visualization if configured for these, will filter the data to this week, and gropu on the month part of those dates. The visualization will then show a single value in a single series trend graph with the month showing as the grain... however the actual values aggregated there will only be for the filtered current week. Maybe someday we'll make it a little smarter.
Dashboard Filter
Dashboard filtering is another relatively new feature added at the end of 2024. this was in high demand by clients as it allows to have fewer common analytics on a dashboard and simply filter the whole dashboard based on common attributes. Much like a date filter but for other attributes.
Now being a new feature, it has a few limitations. One is that it currently doesn't work on virtual attributes. this will be covered in the dataset metadata section, but we do allow for calulated fields. We call them virtual attributes. a dashboard filter cannot be created based ona vitual attribute today, due to indexing limitations. Maybe later this year.

We were smart about this. data security needs to be applied consistently across the board in the Trillabit Platform. When values are presented from the Attributes in a dashboard, data security is applied here as well, so only the data values a user has access to will appear in the dropdown selections for the dashboard filters.
1) Setup (for owner)
Dashboard filters are setup by the Owner or Admin of a dashboard. that is only Owners or Admin can select which attributes are available to filter the dashboard on. Where other user can use those filters that have been setup and change the values as desired.
The filter icon at the top of the dashboard will only appear to dashboard owners or admins. When selected the Owner is provided with a prompt to search for Attributes to filter the dashboard on. when applied the selected attributes will then appear a the top of the dashboard for everyone's use.
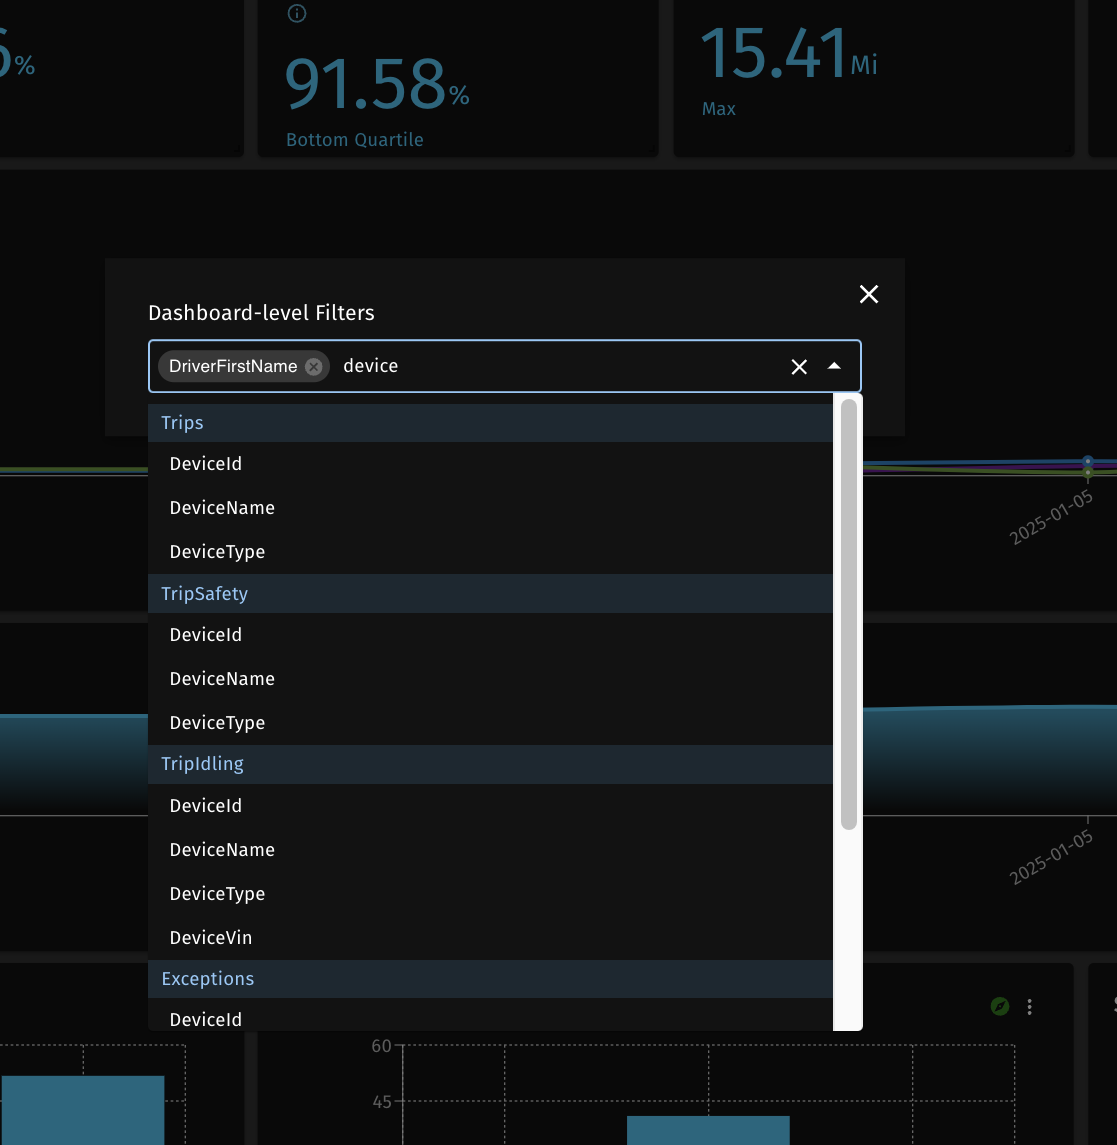
This filter is smart. Since Quick Intelligence allows you to add visualizations based on any dataset to a single dashboard, a dashboard can contain data from many datasets. This attribute seletion dynamically assesses which datasets are already used in the dashboard and only allows you to select attributes from those datasets.
Even smarter, we apply the filters automatically to any visualization that has that attribute in their originating dataset. And do you want to know what's genius? If two or more datasets on the dashboard have an attribute named the same, like FirstName, the value of the dashboard filter will be applied to all of them wether they are directly related or not. All of this happens dynamically and smartly without any further configuration!
2) Usage (end User)
Based on the filters presented at the top which were configured by the Owner or Admins. you as a use can now Select values from one or more of those filters to apply. anythings that is related to the selected filters will be filtered to the values you've selected. You as a user can value and apply what ever values are available in those attributes. You can serach, you can select multiple values in a single filter or across filters. and you can clear and reset those values.
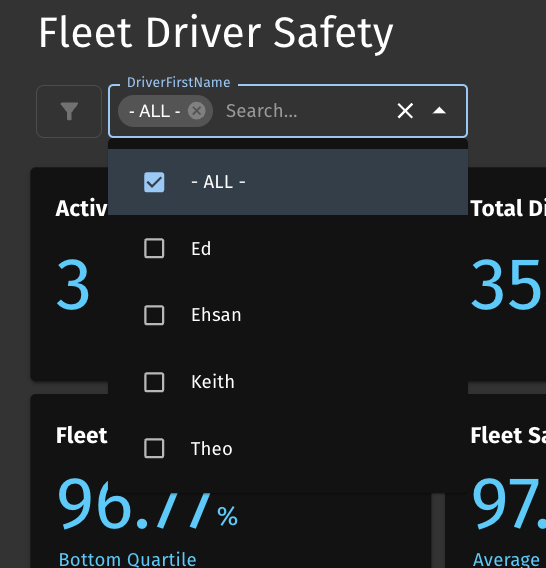
Unfortunately we don't provide the ability to set default values for the selected filters. So as users come to the dashboard they will be empty to begin with. We do see a need for this in the future. Filter defaults and memory will be a feature added later.
Sharing
Dashboard sharing is a must. Analytics is often about collaboration, but there is also a management aspect to this as well. In a self-serve world there needs to remain an aspect of control along with an aspect of freedom to explore... and save. The way we've modelled this is a top down, then side to side sharing approach. Publishing is essentially sharing.
1) Domain
A domain owner may want to create standard out-of-the-box dashboards for all of their clients. To do this, they would create Domain level dashboards with visualizations on domain level datasets (we'll talk about this more in Datasets and in Wuick Intelligence Screen). This owner would then switch to the the different workspaces and share this dashboard with everyone in that workspace or specific groups. Once done, all users will have access to view this dashboard (with data security to their scope). Since the domain owner is the owner of this dashboard, only himself and domain admins change modify this dashboard. This offers a level of static control over this dashboard. Although any user can copy the visualizations to their own dashboards, they can't modify the original.
So publishing from the domain level is simply a sharing mechanism.
2) Workspace
Workspaces are encapsulated environments for clients. they can have their own Admins and be managed at their own level by themselves if desired. Again owners in each work space can create their own dashboards and share them out as standard dashboards to configured groups or everyone within their workspace (they cannot share to other workspaces, their roles are encapsulated within their workspace).
Again this is simply a sharing mechanism
3) Anyone
Finally any user can create their own dashboard and share it to pre-defined groups (this will be covered in the admin section), or to individual users.
4) How to
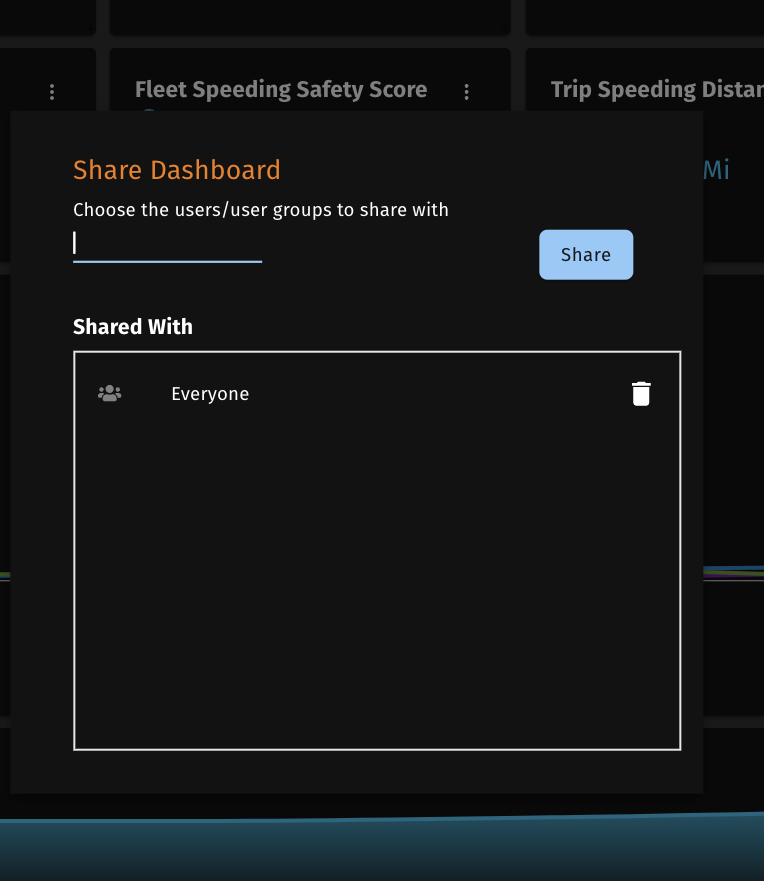
To share a dasboard within a workspace, you simply open your dashboard in that workspace, and click on the share icon at the top right of the dashboard. A popup screen will appear with a search box. Start typing the name og the share group or individual user. the selection will be filtered by your typing until see what/who you want. then select them. Then select the share button. they sill appear in the box below which contains all of the individuals or groups this dashboard had been shared with.
To remove from the existing share list, simply select the garbage can next to the entity and they will be removed. As with most of the platform, this action is automatic.
GOD Mode (Generally Observable Data)
GOD mode is only available to Domain Admins. This won't appear for any other roles. This appears at the top of a Domain level dashboard as a small switch. it will change color when activated.
Domain level dashboards can only be configured with domain level dataset visualizations. When activated, the domain level role overides the workspace level role, allowing for the combined data across workspaces to be view all at once. this is done through a complicated mechanism in the backend and is highly secure.
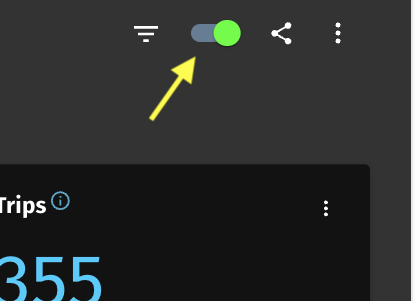
This mode if very useful in visualization data across workspaces to become further aware of utilization across customers. With this function you can create score card types of dashboards at the domain level to understand which clients might be excelling with your product and which may be struggling and require further attention.
Reset
The reset option is a dashboard level formatting option. I'm not sure why we have this. I don't think anyone has ever used it. But essentially this function wipes out all your formatting. You will find this in the dashboard elipses at the top of the menu. It looks like 3 stacked bars. Maybe stay away from this unless you're desparate and want to start over.
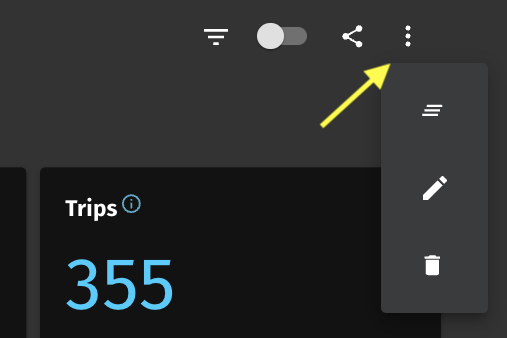
Edit
the Edit option in the dashboard elipses has a few functions in it. this option will allow you to rest the dashboard name, and set defaults.
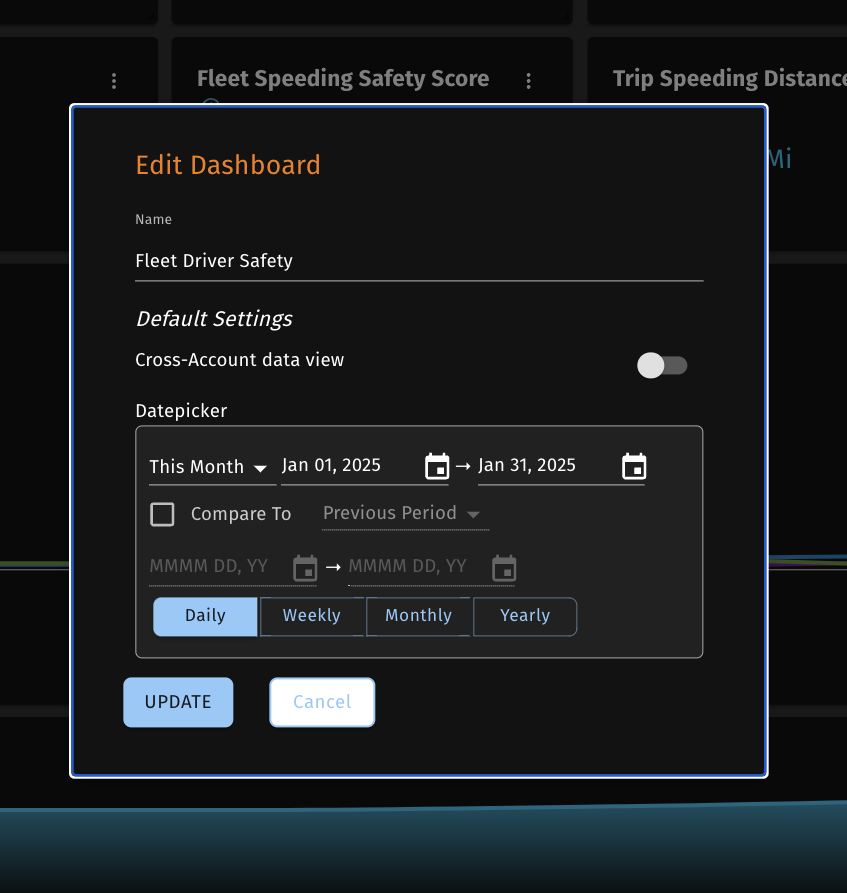
1) Rename
When you create a dashboard, you can name it whatever you want very quickly. But there often comes a time when that needs to change.
2) Cross-Account Data View (AKA GOD Mode)
You can default the dashboard to GOD mode here, just flip the switch as a Domain dashboard owner.
3) Date Picker Defaults
Only Dashboard Owners and Admins can set dashboard defaults. The purpose of this is to set the default settings to something desirable for when users come to you it. For instance setting the Date picker to a particular period and aggregate grain, could be essential to a users experience each time they open this dashboard.
Delete
I bet you can guess what this is. Yup. Just delete the whole dashboard. This has been used a lot, so it's useful. Again, like most of the platform, this is final. If you delete your dashboard, it's not coming back.
Actually if you delete your dashboard and you desparately want it back. Contact [email protected]. We have magical backend recovery. but no guarentees.
You'll find this option in the dashboard elipses at the bottom of the menu as a little garbage can. Be Careful!
Another great thing about dashboards is that you can use them in Quick Intelligence or embed them in your own app or web page individually!